Thursday, 19 August 2021

Time trial aero improvements


CdA time trial improvements
This plot shows my improvements in my 10 mile time trial performance over the last 4 years.

I have been doing time trials since about 2017, having converted my old winter road bike to a time trial bike, using a set of clip-on aero bars.

Over the last 4 years, I've made various improvements to the bike, my kit, and more importantly my position on the bike.

My time trial times have gradually improved.  Not significantly so, but considering my power hasn't really improved during that time, these speed improvements are a result of improvements to my equipment and position.

I do a combination of local club 10 mile evening time trials and also 10 mile TTs organised by DBmax at the local Castle Combe motor racing circuit.  I used the data collected from these Castle Combe time trials to analyse my improvements in performance, particularly my aerodynamic efficiency (CdA), which is a parameter that's critical for good time trial performance.

2017 Equipment

This photo shows my setup in 2017, which was my first Castle Combe 10 mile TT:

- Ribble Audax aluminium frameset.
- Superstar Components 46/66 carbon wheels
- 3T aluminium base bar
- 2nd hand clip-on hand aero bars
- Regular bib shorts and jersey
- Specialized Evade aero road helmet
- Velotoze shoe covers


Over the last few years, I made a number of improvements.  Often, when I had to make a choice about equipment or kit selection, to decide which was fastest, I did aero testing using the Chung Virtual Elevation Method to determine the CdA of various set-ups.  I haven't been exhaustive in my Chung testing, because it’s quite time consuming to do properly, for every change.  However, I've used it for a few things, for example to compare two different helmets and two different skinsuits.

The plot at the top of this post shows the improvements in my apparent CdA over time, determined using the free Golden Cheetah Aerolab software.  This type of CdA calculation assumes no wind, hence I call it 'apparent CdA'.  Furthermore, for all data points, I have assumed similar values for weight and rolling resistance.  Consequently, any improvements in either of those two things will appear as benefits in the apparent CdA value. My weight and the rolling resistance of my tyres has been reasonably consistent though, so this is an acceptable simplification I think.

The largest improvements in CdA seem to have come from lowering my aerobars, allowing me to get my back flatter and my head lower.  I haven't specifically tested bar height via Chung testing, but the biggest improvements in CdA seem to correlate with bar height.  Interestingly, the bar height adjustment was the cheapest upgrade of all, costing me just £15 for an adjustable stem from Decathlon.  All other kit upgrades, costing probably £1000-£1500, didn't seem to be as effective at reducing my CdA.  So the best modification was also the cheapest one.

Subjectively, my position now looks much better on the bike.  In addition to my position changes, I've also improved the bike and kit: 

2020/2021 Equipment
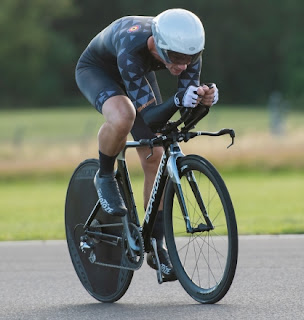
- Boardman Air TT carbon frameset.
- Wiggle Prime Black 50mm front wheel.
- Planet X disc rear wheel
- Single 50t front chainring
- Bell Javelin 2nd hand helmet
- Bioracer/Nopinz Speed Concept skinsuit


A few things were unchanged from my 2017 setup:
- 3T aluminium base bar
- 2nd hand clip-on hand aero bars
- Velotoze shoe covers


Speed Improvements

The plot below shows the improvements in my CdA over time, as a result of the bike and positions improvements I've made.  The colour of the points indicates the average speed for each 10 mile TT.  The size of the circular points indicates that average power I managed to achieve.
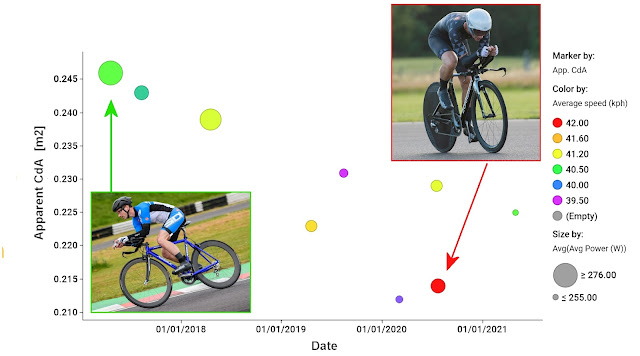


As can be sWhat's clear from the plot above is that the fastest times were not achieved with the highest power (largest circles), but actually the speed is a function of both power and CdA.  In fact, it's clear from the speeds that a reduction in power, often a result of being lower at the front, is more than compensated by an improvement in CdA, resulting in net benefit for the average speed.

For time trials, it's often said that you want to maximise Power divided by CdA.  All things being equal, a time trial average speed will be dependent on this parameter, Power/CdA.  For example, if CdA can be reduced by 10%, then the power required to maintain the same speed also drops by 10%, simple as that.

I wanted to see how my time trial average speeds correlated with Power/CdA.  However, since I was comparing time trial performances on different days, I also wanted to account for changes in air density from day to day, since air density directly affects aerodynamic drag and therefore speed.  Lowering the air density by 10% has the same effect as reducing the CdA by 10%.  The air density effect can be incorporated by considering Power/[CdA*Rho] as the parameter to plot speed against, instead of Power/[CdA].
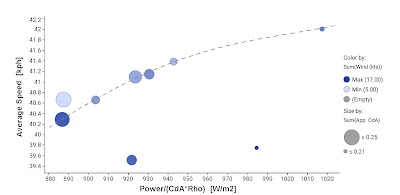

The plot below shows how my average time trial speeds correlate against Power/[CdA*Rho].


In the plot above that you can see that my average speed generally correlates well with Power/[CdA*Rho].  There are, however, two annoying outliers where my speed was very low considering my average power, the air density and my apparent CdA.  I don't yet understand what has caused these two outliers.  I've checked my Golden Cheetah virtual elevation calculation (the CdA calculation) and those seem fine.  It might be something as simple as a badly calibrated speed sensor or a power meter that hasn't been zero'd.


Sunday, 7 February 2021

Real life speeds versus virtual cycling speeds


Comparison of RGT Cycling virtual speeds versus real life cycling speeds
I like the RGT Cycling virtual cycling app.  Unlike Zwift, it has a neat feature that allows you to create 'magic roads', which are virtual roads created from real road GPX data.  Anybody can upload GPX data to create a magic road.

This allows you to ride real roads inside RGT Cycling, so either local roads that you've ridden already, or famous roads that you'd like to ride (created by other people).

In this time of COVID-19 restrictions, it means that virtual races can be organised on real racing circuits, which is pretty cool.  Somebody else has already uploaded my local Odd Down Cycle Racing Circuit to the magicroads.org website.  Virtual races are being organised by PDQ Cycle Coaching, the guys that organised the real life races I did back in 2019.


Odd Down Cycle Circuit
The Odd Down Cycle Circuit is located near Bath, in the South West of England.  It's a 1-mile circuit, with very mild elevation changes and a couple of hairpins that can be taken at speeds below about 20-25 mph.

RGT Cycling also prides itself on providing a realistic virtual cycling simulation, which is something I like.  They strive to get the modelling accurate and the app includes features like braking and speed limits around tight corners, which is something that's different to Zwift, for example.

I thought it would be interesting to compare my real life cycling speeds around the Odd Down Circuit with the virtual speeds achieved in RGT Cycling.


Real life speeds

PDQ Cycle Coaching Odd Down 4th Cat Race 2019
I extracted speeds from three races I did in Spring/Summer of 2019.  I only extracted speed from the warm up laps, not the races themselves, so that the speed would not be subject to drafting.  The average power during these warm ups varied from about 150W to 260W.  I usually do a ramp-type warm up, with the power held constant for 2-3 minutes at a time before increasing it. Therefore, most of the warm-up laps were done at roughly constant power.

The data from three separate warm ups (three different days) allowed some checking of the influence of external weather conditions, which would affect average speeds.  Lap speeds were obtained from Strava for the one-lap segment that has been created in Strava.  Results are shown below with blue symbols.

Comparison of RGT Cycling virtual speeds versus real life cycling speeds

I also wanted to check my CdA because any speed discrepancies with RGT could be due to different CdA assumptions by RGT.  I estimated my CdA by loading my warm up GPX data into Golden Cheetah and using the Aerolab Chung method virtual elevation plots to determine CdA.  My CdA could be estimated for two of the three warm ups, and was 0.360 and 0.375 m^2 for those two warm ups.  I had to make some assumptions/guesses about the rolling resistance coefficient (CRR=0.004), the drivetrain efficiency (97%), my total weight (80kg) and the air density (1.2 kg/m3).  It's worth noting that my warm up laps were done on the hoods, with fairly straight arms, whereas my RGT avatar drops into a more aerodynamic horizontal forearm position when speeds are above about 25 kph (15 mph), which is most of the lap. 


RGT Virtual Speeds

RGT Cycling Odd Down
I rode the Odd Down Circuit in RGT Cycling on Saturday 6th Feb 2021, selecting no bots, so that my riding would be solo, with no drafting.  The speeds were measured in the same way, using a Strava segment, and are shown with the red symbols on the plot above.  The RGT ride was also loaded into Golden Cheetah, making similar assumptions about CRR=0.004, drivetrain efficiency (97%), weight (80 kg) and air density (1.2 kg/m3).  This gave a CdA value of 0.285, which is quite a lot smaller that my real life CdA of 0.360-0.375.  Incidentally, I saw a tweet from Robert Chung a while ago, saying that he had found that Zwift also assumes a rather optimistic CdA of 0.28.


Differences and possible reasons

The general agreement in the plot above seems to be not too bad on the face of it, but it's not great either.  The RGT speeds are approximately 1-2 mph higher, and this I think comes primarily from the lower CdA assumed by RGT.  The difference of CdA, 0.285 in RGT versus 0.370 in real life, is quite significant.  That difference would result in a speed difference of 1mph at 250W, or about 30W at a fixed speed.

Of course, RGT is not trying to simulate me personally, and it has no idea how aerodynamic my bike and body combination is, or was during those warm ups.  It's worth bearing in mind that my warm up laps were done on the hoods with fairly straight arms, so that position will be less aerodynamic than what RGT is assuming.  I also wasn't wearing a skinsuit, and hadn't shaved my legs, both of which the RGT avatar has.  These are differences that Specialized have shown in their videos have a significant effect on aerodynamic efficiency.

It's also worth noting that I used the same power meter for all rides, including indoor RGT ride, so there should not be a bias coming from using different power meters.  It is possible that my left crank only power meter is slightly over-estimating my power, and there is some evidence of this based on recent testing.  An over-estimated power would result in RGT speeds that are higher than real life, and could also partially account for the different apparent CdA values. 

Overall though, I think the differences are primarily coming from the different riding position that RGT is assuming (horizontal forearms), relative to the position I adopted during my real life warm ups (almost straight arms, more upright torso).  Wind tunnel test performed by Aerocoach in 2019 showed that dropping the elbows into a horizontal forearm position ('breakaway hoods') significantly reduced Xavier Disley's CdA from 0.3506 m^2 to 0.2718 m^2.  This reduction of around 0.08 m^2 is very similar to the CdA differences extracted from my RGT ride and my real life rides, for similar changes in position.  Therefore, I conclude that the RGT cycling simulation is accurate, once you factor in the cycling positions that are assumed and adopted by the RGT avatar.

Besides this quantitative comparison of speeds, there is a qualitative element too, particularly around the cornering.  I found the RGT simulation of corners to be fairly realistic.  In real races, I usually have to brake for the hairpins due to the concertina effects when riding in the bunch.  During warm ups or solo breakaways, though, I often don't need to brake.  I remember holding about 280W during one solo breakaway and not needing to brake, although that was very close to the limit.  In RGT, the same thing happened, with just a momentary 1-2 seconds of braking before the bottom hairpin during the laps at 270W.  Qualitatively, this seemed to agree with real life, although it's difficult to be too conclusive.


Conclusion

All in all, I'd say that the RGT simulation is a realistic simulation of real life riding around my local Odd Down Cycle Circuit.  Where differences exist, I think there are some plausible explanations for what might be causing those discrepancies.  


Sunday, 31 January 2021

A quick attempt at real-time CdA measurement


Real time (instantaneous) CdA bike drag extraction
This post describes my attempt to calculate the real-time (instantaneous) drag that I'm experiencing when I'm on my time trial bike, using data from my power meter, altimeter and speed sensors.

For several years now, I've been measuring and trying to improve the aerodynamic drag of my time trial bike.  For time trials, the aerodynamic drag is critical to how fast you can go, because on a flat road most of your power (~80% of it) is expended to overcome the aerodynamic drag.  Put simply, if you can improve your aerodynamic efficiency (your "CdA") by let's say 10%, you can reduce the power needed by around 10% while maintaining the same speed.  Alternatively, you will go faster for the same power.


What is CdA?

Aerodynamic efficiency is defined for cyclist using a parameter called CdA.  In fact CdA is two parameters, multiplied together: Drag coefficient (Cd) and frontal area (A).  The drag coefficient defines how aerodynamically efficient a certain shape is, regardless of its physical size.  For example, a beach ball and a baseball will both have the same drag coefficient*, Cd, because they have the same shape (a sphere), even though they are obviously different in  size.  If both balls are subjected to the same air speed though, the larger beach ball will experience a larger drag force in Newtons, because it has a larger frontal area (A).  In fact, the drag force will be ten times greater, for example, if it's frontal area is ten times greater than the baseball.  Therefore, it's convenient when we are adjusting both the shape of a bike/rider (Cd), and also the frontal area (A), as we usually do when adjusting a time trial set-up, to combine both of these parameters.  It is the product of these two parameters (CdA) that we want to minimize in order to go faster.

* There are a few caveats to this statement, but I won't go into those details here.

The Virtual Elevation Method (aka The Chung Method)

In the last decade, the excellent virtual elevation method, invented by Robert Chung, has become the standard method for triathletes and time trialists to measure their CdA in the field (i.e. on standard roads, not in wind tunnels or velodromes).  Additional information about the method can be found on the Slowtwitch Platypus Thread.

I have been successfully using this method for several years to measure and improve my CdA.  The trouble with it is, though, it's quite time-consuming to collect and analyse the data.  The way I do testing, to test two bike setups, back-to-back, then to repeat them to be sure ('ABAB' testing), takes about 40 minutes of riding time, with about 10 minutes per setup. The analysis of the results probably then takes another 30 minutes to 1 hour, once I'm back home. 


Real-time CdA

I wanted to see how feasible it would be to extract the CdA value in 'real-time'.  That is, at 1 second intervals, could you extract the CdA based on the measured power, elevation and speed?  All of that data is used by the Chung method, but it is processed in a different way, to give you the 'average' CdA over the run.  To extract real-time CdA, you simply solve the power equation on slide 14 of Robert Chung’s VE presentation to solve CdA, using the instantaneous measured elevation, instead of the usual procedure of guessing a value for CdA and then solving elevation.

I attempted to extract real-time CdA using data from a 10-mile time trial I did in 2019.  I didn’t have high hopes that it would be successful, but I was curious anyway and wanted to give it a go.

My findings? Well, the noise in the resulting real-time CdA values was even worse than I expected, with real time CdA values ranging from -1.4 to +1.0 m^2!  (the green trace in the Figure 2).  The average of the real time CdA data, over the 10 miles, was actually relatively good, agreeing with the CdA from my virtual elevation analysis to within 0.01m^2 (0.220 vs 0.213, as shown in Figure 1).  However, the noise in the real-time drag clearly makes it unusable as a drag extraction method though.


Castle Combe Chung Method virtual elevation CdA analysis
Figure 1: Virtual elevation (Chung method) CdA calculation


Real time (instantaneous) CdA bike drag extraction

Figure 2: Real Time (instantaneous) CdA calculation


What I realised is that the noise in the CdA calculations, to a large extent, comes from the poor precision of my Garmin’s elevation measurements, coupled with sensitivity of the CdA calculation to elevation errors.
 My Garmin elevation data has a precision of 0.4m (or at least I see 0.4m increments in its output).

The high sensitivity of the real time drag to elevation is best explained with an example, assuming the following:

Mass = 80 kg rider+bike, Speed = 45 kph, CdA = 0.217 m^2, CRR = 0.004, Power = 300W, Rho = 1.2 kg/m^3, 97% transmission efficiency.

In this example, 252W is overcoming aerodynamic drag.  A 10cm increase (or error) in elevation over a 1 second period equates to a slope of 0.8%, is 78 Joules of potential energy (80*9.81*0.1) and is therefore 78 Watts that gets injected into the power balance equation.  This results in a 31% reduction in the real time CdA ((252-78)/252) if speed remains fixed.  Of course, if the elevation really did increase by 10cm, there would be an associated reduction in speed for a constant power, which would offset the potential energy change, and the CdA would remain the same.  However, the precision of the Garmin barometer means that large elevation steps (40 cm in my data) were introduced into the real-time CdA calculation, causing the CdA spikes.

This sensitivity to elevation data can be mitigated by using longer sampling periods, for example 30 seconds, as shown in the dark green curve in Figure 2.  Alternatively, or in addition, more accurate elevation data would help, and I know there are some folks (for example, see here) that are using more precise barometric sensors to help with this.  The example above, though, shows it’s a tough problem to crack.  Even a really small 1cm elevation error would be a 3% drag change over 1 second.

The beauty of the Chung Method, the way I see it, is that it disregards this instantaneous elevation data that CdA is so sensitive too, and instead calibrates to known elevation information over a longer time period, thereby elegantly avoiding this difficulty.  Another alternative to avoid this elevation sensitivity, of course, would be to ride a perfectly flat road like a velodrome.  However, I’m lazy and would prefer to do my testing 5 minutes away from my home!


Conclusion 

This exercise, although it was generally unsuccessful, was useful in showing why the Chung Method works so well, by avoiding the use of inaccurate elevation data that would otherwise cause difficulties.

It also shows that it's incredibly difficult to extract your instantaneous CdA value, using the power data from your power meter.  On a perfectly flat road it would be feasible, but not on a random road where you have to rely on measured elevation.  The idea of looking down at your head unit, and to see your CdA displayed (as you do for your power or speed), would be brilliant.  Unfortunately it seems that would be very difficult to achieve.


Thursday, 14 January 2021

1x (single chainring) conversion for Shimano 105 chainset


1x single ring Gravel/Cyclocross conversion for Shimano 105 chainset
This is my Shimano 105 chainset that I've converted to a 1x system.

Buying a brand new 105 chainset and then converting it to a 1x single chainring setup was, surprisingly, both cheaper and also lighter than buying a dedicated Shimano GRX 810-1 1x chainset.

Previously, I had a SRAM Rival chainset on my cyclocross/gravel bike.  I wanted to swap my Rival chainset for a Shimano one, so that I could then install a Stages Shimano power meter, which would be the same brand and type of power meter as what's on my road bikes.

If I had bought a Stages GXP power meter that would have been more expensive than the 105 power meter and also would not have been interchangeable with my other bikes.  Initially I planned to get Shimano GRX 1x chainset and a GRX or 105 power meter. However, I learnt that Shimano has created the GRX groupset to have a slightly wider Q-factor than the Q-factors of their road groupsets, like 105 etc.  This, again, would have meant the GRX power meter would not have been interchangeable with my other bikes, should I ever want to swap them around in the future (albeit with a Q-factor difference that is very small).

I decided instead that I'd get a new 105 chainset, convert it to a 1x single chainring set-up, and couple that with 105 Stages power meter.  Surprisingly, this 105 1x setup is both lighter and cheaper than the top level GRX 1x 810-1.  Comparisons are made against the more expensive and lighter 810 version of GRX.  Shimano also make a cheaper, heavier GRX 600 groupset too.

A comparison of prices and weights is shown below:

  Shimano GRX 810-1 42t      Shimano 105 1x 42t     Difference
RRP   £214.99         £186.59     £28.40
Current Wiggle Price   £179.99      £168.19     £11.80
Weight   656g      632g      24g

Cost and weight breakdown:
Shimano 105 5800 chainset without rings & bolts:  £154.99 RRP,  £136.39 current Wiggle price, 549g  
4 x chainring bolts:  £5.19 from Ebay, 6g
42t J&L wide/narrow chainring: 26.60 from Ebay, 77g
All 105 and 1x components were weighed myself.  GRX weights were taken from Shimano website

Sunday, 27 December 2020

Low cost, space saving squat rack


Low cost, space saving, DIY home squat rack

With gyms closed for most of 2020, due to COVID-19, I decided to set-up my old weight bench and start doing my strength training at home instead.  What I've always lacked, though, is a squat rack.

The problem is, squat racks are expensive.  At least £130 for a cheap, non-adjustable one.  I can't justify that expense, considering the modest amount of strength training I actually do each week.  Also, they take up a lot of space, having a large footprint. It's space that I don't have in my garage.  

My solution has been to build a rack that hangs from the garage ceiling rafters to support the barbell. The function of the lower 'bar catchers'/spotters on a proper squat rack is then achieved using Olympic gymnastic rings and straps.

The timber, hooks and coach bolts cost about £25 from B&Q and Screwfix.  The hooks were rated as 90kg load capacity each (180kg total for two). I'm currently squatting about 70-80kg, so that will be plenty strong enough.  The gymnastic rings and straps cost £10 from Ebay. When I'm not using it, the timbers arms fold upwards and hook onto the ceiling, out of the way.  The video below best shows how it works.


Monday, 7 December 2020

Stages Power Meter Cross-Calibration


Cross-calibration of Stages Power MeterI recently bought a new Stages 3rd generation power meter (PM) for my new gravel bike.

This is the third power meter I now own, with the other two also being Stages PMs. The other two PMs I own are on my road bike and my time trial bike (a 1st gen and 2nd gen Stages PM respectively).

I decided to buy another Stages, partly because Stages PMs are good value for money (this third one was less than £300 brand new), and partly because I was keen to have the same brand of PM on all bikes.  My hope was that by having the same brand of PM, they would deliver consistent power values between the three devices.  However, I wanted to check how consistent they actually are...


Method

The best way to do this, I decided was to use my Wahoo Kickr Smart trainer as the 'balance'.  In general, the power numbers from smart trainers are not considered to be as accurate as those from dedicated power meters. However, with some care, the power values from the my Kickr smart trainer should at least be consistent, meaning that my Kickr could be used a common power source to enable the other devices to be compared with each other.  The agreement with the values from the Kickr is unimportant.

Some care was taken to ensure consistent testing of the three devices
  • Testing was done in the same gear, 50t front, 16t cassette, and at the same cadence (85rpm)
  • The same pedals and RH crank/chainrings were use for each PM test.
  • All PMs were stored in the same place (same temperature) before installation.
  • The Kickr smart trainer was connected via bluetooth to my iphone.  The power meter was connected with ANT+ to my Garmin Edge 520, to provide independent recording methods.
  • Exactly the same PM installation sequence was done each time.
  • The same testing protocol was done for each PM.
The protocol for the testing was as follows:
  1. With no power meter installed, I warmed up the smart trainer for 15 minutes at 140-170 Watts.
  2. The smart trainer was then calibrated. No further re-calibration of the trainer was done.
Then, for each of the three power meters, the following was done:
  1. Install the first power meter. LH crank bolts tightened to 12Nm.
  2. Power meter calibrated (zero offset) via the Stages app.
  3. Collected power data at the first power setting, 150W:
    • Use TrainerRoad app to set the smart trainer target power to 150W in ERG mode.
    • Pedal for 1 minute to allow everything to stabilise.
    • Press the lap button, and pedal for a further 2 minutes to collect power data.
    • Record the average power from the power meter (Garmin) over the two minutes.
  4. Collect power data at second power setting, 215W, using the same steps.
  5. Collect power data at third power setting, 280W, using the same steps.
  6. Optional: Collect repeat power data at 215W and 150W if time, energy, and motivation permit.
The order of testing the power meters was:
  1) Stages Shimano 105 7000 Gen 3 power meter
  2) Stages Shimano 105 5800 Gen 2 power meter
  3) Stages Shimano Ultegra 6700 Gen 1 power meter

4) A fourth run was done with a repeat of (1), the 105 7000 Gen 3 power meter, to check the repeatability after a PM re-installation.


Results

Cross calibration of Stages power meter using Wahoo Kickr

Repeatability

You can see from the plot above, that there's a fair amount of variation seen in the results, not just between the three power meters but also some significant changes seen in the repeats.  Ideally, the repeats should be very close to the first recordings, so what can we learn from this?

Starting with the repeats, the installation repeat run gave some differences of 2-11 Watts between run (1) and run (4) for the same power meter. There are several possible explanations for this difference that I can think of:

Explanation 1) The Stages power meter calibration drifted between runs 1 and 4.  This is unlikely because both runs were done with exactly the same protocol, so there is no additional usage of the PM that should cause a drift. For example, it was no warmer on the 4th run, having been inactive for 45-60 minutes.  Also, the differences between the powers are not consistent across the range, so it's not a parallel offset that would otherwise indicate a calibration drift.

Explanation 2)  The Wahoo Smart trainer has drifted.  Again, I think this is unlikely because if this were true, I'd again expect a constant parallel offset to be seen between runs 1 and 4.

Explanation 3) The most likely hypothesis is, I think, that both runs are subject to small changes in my left/right leg balance, with random changes affecting the results.  For example, if at 150W I have a 48/52% left/right leg split, then the left leg produces 72W, the right leg produces 78W to create the 150W (real) power total. However, the Stages PM always assumes the right leg also produces the same as the left, 72W, so the Stages PM would give a total power of 144W. If that L/R balance then swings by 4% to 52/48% L/R instead, then the left leg produces 78W, the right leg produces 72W, but the Stages PM gives a total power of 156W.  So a swing of 2% asymmetry to the left, to 2% assymmetry to the right, will create an apparent power difference of 12W for the same actual 150W power total in both cases.  If the target power is higher, say 280W, that same swing would be higher, 22.4W.

I think this is third explanation, of random small changes to the L/R leg imbalance, is the most plausible explanation of the 2-11 Watt variation seen in the installation repeat. It also explains why similarly large differences are seen in the repeats that were done before uninstalling each power meter (step 6 in the method).

Power meter differences

The differences between the power meter results has to be considered with a view of these repeatability results.  However, even considering the repeatability, and the uncertainty that it introduces, I feel the Gen 2 105 power meter (the red data points) is reading higher that the other two PMs.  Although its difficult to be conclusive, I would say the the Gen 2 105 PM is reading around 10-Watts higher than the other two.

This isn't a huge difference, but it is large enough that I'll need to take it into consideration when riding close to my limit, close to threshold.  This Gen 3 105 PM will go onto my gravel bike, with the Gen 2 staying on my Road bike, which I use for most training, FTP tests etc.  I will therefore have to keep in mind that the power values on my gravel bike may read a little low compared with what I am used to on my road bike, for the same effort level. 

Friday, 13 November 2020

Upgrade recommendations for a friend

In a 2016 blog post, I described an analysis that concluded about the best value for money upgrades that people can buy for their road bikes.

Last week, in my previous post, I described the power delivery optimisation that I did for my friend Steve, to show how much faster he could go just by changing when he pushed harder on his favourite bike route and when to ease off.  I followed this up with a quick study to show how much benefit could be achieved with certain bike and kit upgrades.

The analysis I did was basically the same as the 2016 analysis, except it was done for Steve's lunchtime bike route, instead or three generic bike ride profiles.  The results are shown in the bubble plot above.  I've shown it with upgrade price on the x-axis, and the equivalent power saving in the y-axis.  Items that represent the best value for money (Watt saving per £ spent) have the largest bubbles.

The conclusions are similar to those in the 2016 blog post.  Buying latex tubes represents excellent value for money, probably the best there is.  On the other hand, paying extra money for a lighter groupset (if it has no additional functional benefits) is a really bad way to spend your money, if improved cycling performance is your priority.


Wednesday, 11 November 2020

Power delivery optimisation for a real-life cycling route


How to improve you average speed cycling
In a previous blog post (here) I described a power delivery optimisation analysis that I did back in 2016.  In that work I showed that, using a simple Excel-based optimiser, it's possible to make significant performance gains, a 2-3% improvement in that case, simply by optimising the power delivered during a bike ride for the same normalised power.  In other words, making the most of what you've got.  These improvements were the versus the 'baseline' situation where the ride was done at a fixed (not varying) power output with the same normalised power.  A 2-3% improvement may not sound like much, but to put this into context, that performance gain is equivalent to a 5% power improvement, for a fixed power delivery.  Alternatively, it's equivalent to a 5-6kg of weight loss, which is significant.

That study was done for a fictional 80km route having 1000m of elevation gain.  In 2020, a friend of mine, Steve, who's also an engineer, asked me if there was a better way for him to ride his favourite lunchtime cycle loop.  To give him some advice, I decided to try putting his bike route into my Excel optimiser to see what it would give.  By optimising his power, using the optimised power profile shown in the plot above, he could make an impressive 3.8% time saving and speed improvement, compared with riding the route at a fixed (constant) power.  This blog post describes that work in more detail.


Route setup

First I extracted my friend Steve's lunchtime route from Strava, as a GPX file.  That Strava output gave 276 waypoints on the route, with longitude, latitude and elevation data.

For my optimiser to work, I needed to reduce the number of points to 137 points, which is a number of segments that would be compatible with what Excel's optimiser can handle.

Steve's best time for this ride was 29 minutes, 42 seconds, which was an average speed of 31.8 kph.  I obtained a few other parameters from the  Strava file for his personal best time, then I needed to guess a few others:

Ambient temperature = 6 deg C  (from Strava)
Ambient Pressure = 101.25 Pa  (assumed)
Bike + Rider = 97.5 kg  (estimated)
Mechanical efficiency = 97.5%  (assumed)
No wind  (assumed)

Comparison with BestBikeSplit

As a first check that my optimiser was doing something sensible, I compared the output with
BestBikeSplit.  BestBikeSplit does something very similar, so both methods should give reasonably similar results.  

BestBikeSplit assumed a rolling resistance coefficent (CRR) of 0.00622 and a CdA of 0.3424 [an explanation of CdA can be found here].  I
 used those two values in my own optimiser.  As can be seen from the plot on the left, both methods gave reasonably similar results for a normalised power of 239W:

BestBikeSplit: 29.8 kph average speed
My optimiser: 30.7 kph average speed

Qualitatively, the power distributions in those plots look similar.  The BestBikeSplit optimiser can split the route into only 50 segments, whereas my optimiser used 137 segments. This might be a reason why the average speeds differ slightly.  In any case, I was satisfied that this agreement was close enough.

Tuning CdA

I then tuned the value of CdA so that the optimised ride time was equal to Steve's best ride time.  Reducing CdA to 0.29 was enough to do this, to increase the average speed from 30.7 kph (for a CdA of 0.3424) to 31.8 kph for a CdA of 0.29.  A CdA value of 0.29 is a bit low for a recreational cyclist, in my experience, but Steve often rides with one of two colleagues, so 0.29 seems a reasonable value for his effective CdA, considering that some of the time he'd be riding in the draft of other people.

For this CdA of 0.29, and for a normalised power of 259.8W, I computed the "weighted average power" to be 241.0W and the average power to be 227.3W.

At this point I should note that the way in which Strava calculates weighted average power is not documented anywhere by Strava.  Weighted average values are generally higher than the average power values in my experience, but are always less than normalised power values.  Whereas normalised power is calculated by raising the power values to the power of 4, I assumed that weighted power is calculated by raising the power values to the power of 2.

So to summarise, I now had an optimised power profile (see plot on the left) that produced an average speed that is identical to Steve's PB effort (31.8kph) using the same weighted average power as he produced in real life (241W).  Of course, it's highly unlikely that he would have ridden the route at the optimum power profile, but for the purposes of this study, to quantify the benefits of optimising power, I think that's good enough.  As an observation, it's interesting to see that the power needed to produce this optimised performance varies significantly, from about 20W on the steepest downhill part of the route (-10% gradient) to about 370W on the steepest uphill part of the route (+8% gradient).  Incidentally, the average power and normalised power for this power delivery is 227W and 260W respectively.

The improvement that the optimised power delivery achieves, versus the baseline case of a fixed, non-varying, power delivery can then be calculated by re-running my optimiser with an additional constraint.

How much faster is the optimised power delivery?

I re-ran the optimiser with weighted average power set to 241W, as before, but this time I also set an additional constraint that the average power had to be 241W too.  This additional average power constraint effectively prevented any significant variation in the power, meaning that the power delivery effectively became almost constant at 241W, as shown in the plot above.

The speed of this ride, if performed at this fixed power of 241W, would be 30.6 kph.  This is 1.2 kph slower (3.8% slower) than for the ride done at the optimised power delivery.

Comparison to other improvements

The significance of this 3.8% improvement is not so obvious, but can be put into context by calculating the effect of other improvements:

+10 Watts increase in weighted average power:            +0.7kph improvement (2.2% faster)
Butyl -> Latex inner tubes (-11% rolling resistance):      +0.3kph improvement (1.1% faster)
5 kg weight saving:                                                         +0.5kph improvement (1.5% faster)
Aero improvement through and aero helmet upgrade:   +0.2kph improvement (0.8% faster)

The speed improvements shown above make it clear how significant that 1.2kph (3.8%) improvement is from simply optimising the power delivery, applying the right amount of effort at the right time. 

Finally...

I was curious to see whether there is a relationship between optimum power and gradient.  Clearly, it's impractical, and will get kind of boring, to do this kind of analysis for every route that I might want to ride.  This work and previous work has shown that the optimiser determines that more power should be applied on the uphills, and less power on the downhills, but could there be a general rule? 

How to improve you average speed cycling
For the 137 segments of this route, I plotted on the left the optimum power versus the gradient.  It can be seen that the the points fall onto an smooth S-shaped trend line with no scatter.

Perhaps more useful is the plot below, which is the same data but plotted as the ratio of the optimum power to the average power.  
How to improve you average speed cycling
So for example, you can see that for an uphill section of the route with a gradient of 5%, you should be cycling at a power that's approximately 50% higher than your average power.  Then, for a downhill section, having 5% gradient, you should be at 25% of your average power.

Obviously, this optimum delivery assumes that the riding conditions (traffic, corners, etc) do not limit the speeds, and that is one important caveat on all of this.  Also there is no consideration of what is achievable by a rider.  For example, if the average power is close to a rider's threshold, then they would only be able to hold those optimal higher power on uphill parts of the course for short periods of time.  The optimiser is simply finding the best power delivery profile for the prescribed average power.  In principle, additional physiological constraints could be put into the optimiser, but I haven't tried doing that yet.

As a next step, I'd like to see whether this optimum power relationship holds true for other bike routes and for other cases where there changes are made to either the riding conditions, the bike or the rider. 


Wednesday, 21 October 2020

Zwift folding laptop/ipad table Mk2

In a previous blog post here, I described the folding table that I'd built in 2016, for the purposes of holding my laptop for indoor cycling sessions using Zwift, TrainerRoad etc.

That old table needed to fold up and store flat, because at that time I didn't have a dedicated space for my trainer and bike to be permanently setup.  It had to be set up and collapsed each time I wanted to use it.

In 2000, we extended the rear part of our garage. This extension gave me, amongst other things, a semi-permanent space for my trainer.  The photo above shows the new setup that I've built.

The table is made from plywood and is attached to the wall using door hinges.  The table can fold upwards when it's not in use and store flat against the wall, held in place using cabinet magnets.  The fan is also able to fold inwards, giving me more space on the occasions that I need to put my trainer and bike away and give me more space to do something else. 

Sunday, 26 April 2020

Off-road rolling resistance testing using virtual elevation


Off road tyre rolling resistance (CRR) using virtual elevation
For some time now I've wanted to determine what the optimal tyre pressure would be for off-road conditions, in terms of rolling resistance.

One of my favourite series of races is my local summer cyclocross series, organised by the British Western Cyclocross League. The races are convenient for me, held on weekday evenings during the summer and they are local too, meaning I can ride to and from most races.

These summer cyclocross races use courses similar to most winter CX courses, so a combination of grass and dirt.  With the dry conditions of summer though, the grass stays as grass and it never gets too muddy. For the majority of the time, then, we're riding on grassy surface with a fairly hard underlying dirt surface.

It's always been difficult for me to judge what the optimum tyre pressure is for these conditions. The conventional wisdom amongst cyclocross racers is to use the lowest possible pressure. However, I'm not sure how much this common practice is dictated by traction considerations.  What's the optimal pressure for rolling resistance in off-road grassy conditions, bearing in mind that traction is rarely a problem in the summer?  This is what I wanted to determine.


Methods Available

In a previous post, I briefly talked about the Virtual Elevation (VE) method, which is also called the Chung Method, invented by Robert Chung. This VE method can used to evaluate the CdA, or drag area, of a bike and rider.  The method can also be used to evaluate rolling resistance changes, although this in much less common.  VE testing is general performed by time trialists and triathletes wanting to improve their aerodynamic drag, which is by far the dominant resistive force for these disciplines.  There have been some VE rolling resistance studies done though, for example T.Maier et al.

The methods that are generally preferred for evaluating bike tyre rolling resistance characteristics are drum testing (BicycleRollingResistance.com example here) or roller testing (Tom Anhalt example here).  However, drum testing and roller testing only determine the losses due to deformation hysteresis in the tyre itself, i.e. the energy losses in the rubber when the tyre squishes at the contact patch and rebounds.  It is well known that when riding outdoors, there are also losses that can occur in the bike/rider system as a consequence of the bumps being transferred to the rider.  These additional losses are often called 'suspension losses' (a more detailed explanation can be found in this article).  These suspension losses through the tyre to the rider are greater at higher tyre pressures, when the tyres are harder, which is the opposite of the pressure trend for tyre hysteretic losses.  As a consequence, unless the road is perfectly smooth (which is only true in an indoor velodrome), the combination of suspension losses and tyre hysteretic losses means that there is usually an optimum tyre pressure that gives a minimum coefficient of rolling resistance (see plot below).


For off-road riding, such as cyclocross, gravel or mountain biking, it's important to evaluate the effect of these suspension losses, since the ground can be quite bumpy.  Unfortunately, drum or roller testing would only give part of the picture, the tyre hysteretic loss part.  As a result, for my objective to determine the optimum pressure for summer cyclocross races, I chose to use the Virtual Elevation (VE) method. 


Method details

Bike

Planet X Pickenflick
I performed the testing using my cyclocross bike, a Planet X Pickenflick bike, which is fitted with 35mm Schwalbe X-One Allround tubeless clincher tyres.

For this testing, I fitted the bike with my 105 chainset and LH Stages power meter from my road bike, since power meter measurements are needed to perform VE testing.


Road VE testing and venue

Aztec West Bristol Strava segment

I firstly performed a VE test on a local 1 mile road circuit, for the purposes of determining my CdA.

I would later maintain the same hoods position on the bike during the subsequent off-road testing and therefore assumed that my CdA remained unchanged for the calculation of off-road rolling resistance coefficients.

Golden Cheetah VE Chung Method chart

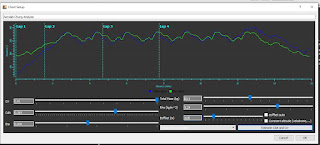
For this road testing, I imported the data into Golden Cheetah to perform the VE analysis.  I concluded that my CdA was 0.393 m^2 and my rolling resistance coefficient (CRR) on tarmac at 45 psi was 0.0100.


Off-road VE testing and venue

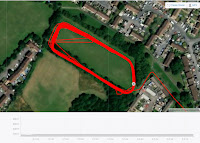
Off-road grass strava segment for VE testing
I then rode about a mile to the south, to a grassy field near my house, to perform the off-road testing.

It's worth noting that I did this testing during April 2020, which was at the start of the COVID-19 pandemic.  At the time, there were a lot of government-imposed restrictions in place, including a requirement for everyone to stay at home except for one exercise session per day.  As a result the field was fairly quiet, with just the occasional dog walker.  This allowed me to maintain a consistent line around the field and I didn't have any interruptions. 

Testing Protocol

My testing protocol is described in full below.  This can also be found in a post and subsequent discussion on the Slowtwitch Platypus Thread, on Page 20, which is a forum page dedicated to discussing the Virtual Elevation testing amongst cycling enthusiasts.  


- Stages 2nd generation left hand crank-based power meter. This is not ideal, to use a single-sided power meter, but it's all I've got.
- Tyre pressures measured with a digital Topeak pressure gauge. Possibly not accurate, but hopefully consistent.
- Garmin speed sensor. I used a constant value for the circumference in my Garmin head unit throughout the test, but then post-processed the results later to adjust the speeds based on the different measurements of when diameter for the different tyre pressures.
- Air density: Pressure from the weather forecast app. Temperature from the Garmin head unit.
- 0.97 transmission efficiency assumed throughout.
- Bike + rider weighing before and after the ride.
- No adjustment for wind. Sessions 1-3 in the chart were done with the forecast wind being 10-15mph. From what I've read, the ground level wind speed is less than the forecast wind speed by about half. My hope is that it would be consistent enough to give good enough increments between the pressures, even if the absolute numbers might be affected by the wind.

Tarmac runs
1) Tyres inflated to 45 psi.
2) 6 x laps of a tarmac oval loop, each lap 1 mile in length. First 3 laps done at ~230W, next 3 laps done at ~130W. No traffic.
3) VE analysis done in Golden Cheetah and Excel to check they give the same result, to check I haven't made a mistake in my Excel equations.
4) CdA and CRR determined post-ride so there is no elevation loss or gain over the six laps, trying also to keep the same flatness for the sets of fast and slow laps. The CdA derived from this analysis, 0.393, was then used for the VE analysis for the grass runs.

Grass runs
Straight from the tarmac runs, I cycled about 1 mile to a local grass field, roughly the size of a football pitch.
1) I checked the pressure before starting at 45 psi.
2) Accelerated up to speed before the maximum elevation point of the lap. Pressed the start/stop on the Garmin about 5-10 seconds before the max elevation point.
3) 3 laps at ~230W, followed by 3 laps at ~130W. I changed gear only once at the transition between fast and slow sets of laps, to keep the cadence reasonable. The time to do six laps was 7-8 minutes. I tried to follow a consistent line, but I had to avoid an occasional dog walker, approximately once every 5 laps (and these days trying to give people at least 5 metres of space!)
4) After the max elevation point at the end of the 6th lap, I continued for ~10 seconds, and pressed start stop on the Garmin.
5) Stopped in the shade. I avoided direct sunlight when stopped to prevent the sun warming the tyres. I checked the pressures, before then reducing the pressure by 5psi ready for the next run. I could get it within 0.5psi of the target. If I overshot the reduction for the first tyre (e.g. 39.5psi), I compensated by leaving the other tyre half a psi higher (e.g. 40.5psi). I chose to reduce pressure, rather than increase it, because I was concerned that pumping the tyre up might increase the internal air temperature and possibly the tyre wall temperature. Letting pressure out was also easier.
6) Step 2 onwards was repeated for 45 psi down to 15 psi in steps of 5 psi.
7) I then went home (<1 mile away), pumped the tyres back to 40 psi with a track pump, returned and followed the same protocol, but in 10 psi steps (40, 30, 20 psi). I wanted to do these repeats because I hadn't done an ABAB type test, and also because the grass was becoming increasingly flattened, which I think might have affected the CRR.
8) I also did a few repeats two days later, on a less windy day (~5mph wind according to the forecast)
9) CRR values were obtained to give no elevation gain/loss over the 6 laps, using the fixed CdA of 0.393. I obviously tried to keep the same kit and position on the bike throughout.


Results and discussion

Off road tyre rolling resistance (CRR) using virtual elevation


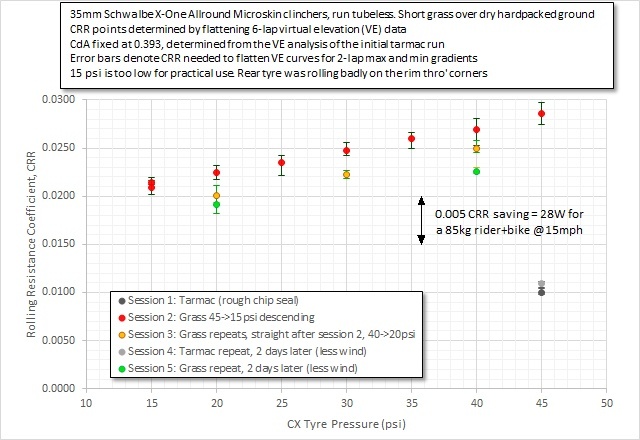
The results shown above surprised me somewhat.  The grass and the underlying surface felt reasonably smooth as far as off-road riding is concerned, with few bumps.  I was therefore expecting the suspension losses to be small.   What surprised me therefore is that there is no minimum in the plot, no optimal pressure.  It's clear that the lower the pressures, the lower the rolling resistance.  It seems the conventional wisdom of cyclocross racers, to go as low as possible with tyre pressures, may be right for rolling resistance as well as for traction.

I had a short discussion about these results with some of the experts on the SlowTwitch forum.  Tom Anhalt made an interesting comment that studies done for the Swiss MTB team a few years ago concluded the same way, that lower pressure is best.  He also said that the deformation of the surface (the ground, grass and dirt in this case) may be a large contributing factor, which in contrast is a negligible effect for the road.  This was a really interesting insight, and made me realise that for off-road riding, in addition to tyre hysteretic losses and suspension losses, there is a third source of rolling resistance, and that's hysteretic losses in the ground.  For anybody that has even tried cycling on sand, you'll be very aware that these hysteretic losses in the ground can be rather large!


Conclusion

The results showed me that I need to run my tyre pressures as low as possible.  The limit, to how low I could go, is however governed by a couple of factors:

  • Tyre Stability: I found that below 20psi the tyre rolled around badly on the rim when cornering.  In these situations, a tubeless tyre can also 'burp' air, which can end a race if it happens a few times.
  • Pinch flats: Even running tubeless, running very low pressures means that hitting rocks and hard obstacles can cause pinch flats in the tyre casing that won't seal.
As a consequence of seeing these results though, I am now running my tyre pressures much lower than before, and flirting with that limit for pinch flats and tyre stability.  To try to avoid those problems, and to facilitate lower pressures, I'll be trying out foam tyre inserts in the future.