Showing posts with label Power Delivery Optimisation. Show all posts

Sunday, 14 January 2024

Validating my power delivery optimiser: Step 4

Excel-based optimiser versus Best Bike Split
Step 4: Calculating the optimum power delivery profile using my optimiser.  

In the previous blog post (Step 3), I showed the BestBikeSplit recommended power profile and the results of my Zwift ride when I followed BestBikeSplit's recommended power profile.  It saved me 9 seconds compared to the constant power effort, for a similar 150W normalised power.

I will now see if my Excel-based power optimiser gives similar results when I model the Whole Lotta Lava segment using the same set of 29 intervals that BestBikeSplit used to model the segment.


Results of my power optimiser

The plot above, at the top of this blog post, shows the BestBikeSplit recommended power profile (dashed red line) and then the power profile recommended by my Excel-based optimiser (solid red line), when targeting a 150W normalised power. The agreement between the two plots is remarkably good.  In the past I've done a crude comparison between my optimiser and BestBikeSplit (see here), but I've not plotted the powers on the same graph before.  This really shows the two methods give the same results, and so it shows my Excel-based optimiser is a free alternative to BestBikeSplit.  It could actually be even better than BestBikeSplit if I'm able to model more intervals than BestBikeSplit.  I just need to write the script that can automate the creation of the intervals.


Predicted ride times from my power optimiser

For the constant power situation, with the power fixed at a constant 150 Watts, my optimiser predicts a time of 27 minutes and 17 seconds. Note that this is only 2 seconds different (0.1% different) to my actual Zwift ride time of 27 minutes and 15 seconds, which I've obtained on two occasions riding at a constant 150 Watts.

To achieve this constant power of 150 Watt simulation in my optimiser, I set-up a multiple goal-seek macro in Excel.  That was an interesting learning exercise in itself, because I have never programmed in Visual Basic before.

Running the optimiser to achieve an optimal power profile, my optimiser predicts a time of 26 minutes and 37 seconds, which is a fairly significant 40 seconds (2.4% saving).  That's very similar to the 2-3% savings that I was getting when I first created my power optimisation spreadsheet back in 2016 (see post
here).  The speed and power differences between the constant power case and the optimised power case are shown in the plots above.


Summary

Riding at a constant 150 Watts, my optimiser predicts a time of 27:17.
(average power = 150W, normalised power = 150W)
That 27:17 time agrees very well with the actual ride time in Zwift of 27:15.

Riding at the optimum power, my optimiser predicts a time of 26:37 (40s faster)
(average power = 143W, normalised power = 150W)
I haven't yet tried following this power profile in Zwift yet, and although the BestBikeSplit power profile is similar, the speed modelling deficiencies in BestBikeSplit (described here) was insufficient to test this.


Next Steps

The next step is to create a script that can process the Whole Lotta Lava segment profile, and any other ride profile, in a more efficient way with less manual effort by me.


Saturday, 13 January 2024

Validating my Power Delivery Optimiser: Step 3

Step 3: Using BestBikeSplit to create an optimum power delivery profile.  

In my previous blog post, I explained that the following values are needed to simulate the Zwift ride:

  • Total weight (rider + bike) = 80 kg (176.4 lb)
  • CdA (drag coefficient x Frontal area) = 0.2415
  • Crr (coefficient of rolling resistance) = 0.004
  • Air pressure = 101,250 Pa
  • Air temperature = 15 degrees C
  • Air density = 1.225 kg/m^3
  • Drivetrain losses = 2.5%

BestBikeSplit modelling via ZwiftInsider

I first tried to use this BestBikeSplit link that is available via the ZwiftInsider Whole Lotta Lava route page to access Best Bike Split.  The page assumes a fairly light rider weighing 145lbs, and makes some other assumptions. However, 
the Time Analysis tab allows the user to change the value of various parameters using sliders to adjust the parameters in 1% increments to the necessary value.  Unfortunately, this method didn't allow me to enter the exact values above, so I used the closest values possible instead:

  • CdA = 0.24 (i.e. 0.0015 too low)
  • Average power = 144.5 Watts
  • Normalised power = 149.9 Watts (0.1 Watts too low)
  • Weight = 177 lb (i.e. 0.6 lbs too high)
  • Crr (coefficient of rolling resistance) = 0.004 (exactly as required)

Note that I tried to get the normalised power as close as possible to 150 Watts.  It's unclear what assumptions BestBikeSplit has made for air density and drivetrain losses.  Nevertheless, with these values, BestBikeSplit predicts a route time of 27 minutes 42 seconds, which strangely is 27 seconds slower than my constant power time.  I didn't understand this, so I needed to investigate why.


BestBikeSplit dedicated race plan

Since the results above seemed to make no sense, I decided to create a dedicated BestBikeSplit race plan, which is possible even with BestBikeSplit's free account.

I was able to change the settings so that the parameters were exactly matching what I wanted:

  • Rider weight = 160 lbs, Bike Weight = 16.4 lb -> Total weight = 80 kg (176.4 lb)
  • CdA = 0.2415, for all yaw angles
  • Crr = 0.004
  • Drivetrain losses = 2.5%
  • Air pressure = 101,250 Pa
  • Air temperature = 15 degrees C
  • Zero wind speed
  • Drivetrain losses = 2.5%
These values give a route time of 27:47 for a normalised power of 149.94W and an average power of 141.93W, which is bizarrely still 32 seconds slower than my constant power Zwift time.


The final section of the BestBikeSplit Race plan above provides 'race intervals' which show the segment distances and gradients, then the power recommended by BestBikeSplit, together with the resulting speeds.  I copy and pasted those 29 race intervals into Excel and calculated segment distances in metres, instead of miles: 


I then copied the distance, gradient and speed values into my power optimiser spreadsheet to allow me to compare the power values calculated by BestBikeSplit and values calculated by my spreadsheet.  Surprisingly, the power values agreed for some of the route, but were significantly different for the downhill section, as shown in plot below for the solid red and dashed red lines:


As soon as the gradient becomes negative, BestBikeSplit (the red dashed curve) is showing that a higher power is needed to achieve the downhill speeds that BestBikeSplit has calculated.  I really don't understand this because, for example, it is calculating speeds of 23.08 mph on a -4.36% (downhill) gradient while applying 84 Watts of power.  That is clearly wrong and I didn't know why BestBikeSplit is doing that, unless it is somehow assuming a large headwind

To investigate this, I plotted the BestBikeSplit powers and speeds versus the gradient values, shown withe red symbols on the plot to the left.  The plot looks reasonably sensible, although the scatter seen in the corresponding speeds is slightly strange. 
Regardless of these doubts, I decided to try to ride the route using the BestBikeSplit power profile to see what time it would give.

Riding the BestBikeSplit power profile

To do this, I decided to use the BestBikeSpilt's feature where they allow the power profile to be exported as a TrainerRoad workout.  
This is a nice feature, because it allowed me to ride exactly the prescribed powers by doing the workout in ERG mode, with my phone (for TrainerRoad) and also Zwift (via my iPad) connected to my Wahoo Kickr trainer.  The workout included the 29 intervals contained in BestBikeSplit's race intervals.  As shown above, I also added a long 150W interval afterwards to allow me to do a second lap at a constant power, if I wanted to.

I started the TrainerRoad workout as I got to the archway that marks the start of the Whole Lotta Lava segment.  As a reminder, the segment time I did previously with a constant 150W power output was 27 minutes and 15 seconds.  Using the BestBikeSplit power profile, I did a time of 27 minutes and 6 seconds, so 9 seconds faster than the constant 150W effort.  It's worth noting that although the normalised power for the BestBikeSplit run was about 150W (actually slightly lower, at 148W), the
average power was substantially lower at 140W.  This is interesting in itself, and a positive results, that the average power was 10W lower than the constant 150W effort, but the time was 9 seconds faster.

However, something I noted when riding the segment with the BestBikeSplit power profile was that at several times the target power did not correlate well with the gradient.  At most times it was good.  For most of the uphill sections, the target power was higher than 150W, as  expected.  At some points, though, the target power didn't correlate with the gradient.  For example, the high power interval stopped about 10 or 20 seconds too soon, before I reached the top of the climb, on the steepest part, which seemed odd.  Therefore, I think that due to the BestBikeSplit speed issue mentioned previously, I think there was a synchronisation problem between the BestBikeSplit simulation and what actually happened in Zwift when those powers were ridden.  I have the feeling that the most likely explanation is that BestBikeSplit is assuming some wind that is not actually there in Zwift.

It's worth also be noting that the 27:06 time is significantly faster that the 27:47 time predicted by BestBikeSplit, indicating that their calculation of Zwift speeds are wrong, despite me entering the details such as Crr and CdA correctly. 

Finally, it's interesting and encouraging that my second lap of the Whole Lotta Lava segment was done again at 150W constant power, and again this gave exactly the same 27 minute 15 second segment time as I achieved before (described in my previous blog post).


Summary

This has been quite a long post, so let's recap:

Riding at a constant 150 Watts gives a time of 27:15.
(average power = 150W, normalised power = 150W)

Riding at the BestBikeSplit optimum power profile gives a time of 27:06 (9 second saving)
(average power = 140W, normalised power = 148W)


Next Steps

The next step is to see whether my own Excel-based power optimiser gives similar results, and to do that I will be to create a scripts that can process the segment profile in a more efficient way, with less manual effort by me.


Saturday, 30 December 2023

Validating my Power Delivery Optimiser: Steps 1 & 2

Steps 1 & 2: Gathering data and rider parameters for the constant power case.  

The introduction post written previously (here) explains the objective and context of this Step 1 & 2 of the study.

Route Selection

Firstly, I needed to decide a suitable route.  Strange as it may seem, I didn't want to use an outdoor route.  The difficulty of doing a test like this outdoors is that the conditions are so variable. The wind changes, traffic interferes with aerodynamic drag and gets in the way, road junctions have to be avoided, etc.  Then I would also have to ensure my bike, my power meter and my body position stayed consistent between runs.  

I really wanted to avoid those constraints and difficulties associated with doing the test outdoors, so I instead decided to use a virtual route on Zwift.  This is also not ideal, because the bike speed in Zwift is calculated with a computational model, so I'll effectively be using a model (Zwift) to validate another model.  However, I feel that the benefits of having a fully controlled environment to test the power delivery optimiser outweighed the doubts and downsides that may come from using Zwift.

For the route, I decided to use the Whole Lotta Lava route.  I picked this route because it was reasonably short at 12.3km (7.6 miles), so it would take less than half an hour to ride.  Also, it includes a good mix of terrain, with a flat section, a climb and a descent in approximately equal amounts, as shown in the route profile to the left.  The amount of climbing, with 160m (525ft) climbed in 12.3km is the kind of elevation change that I typically see in my local rides and the terrain in the South West of England where I live.

Finally, the route is almost entirely pavement, which makes the treatment of rolling resistance somewhat easier.  There is a short section of wooden boardwalk, perhaps 200m in length that has to be crossed on climb and the descent, but I'm hoping that is not significant enough to complicate the modelling.

Bike Choice

For this type of test, a TT bike is the best bike to use, because Zwift does not allow a TT bike to gain a benefit from drafting other riders, unlike for their road bikes.  This means that any ride I would do on a TT bike, and the associated segment time for the Whole Lotta Lava route, would not be affected by the presence of other riders.

In Zwift I have the Canyon Speedmax TT bike with Zipp 808/Super 9 wheelset.


Riding the route at constant power

I decided to perform the constant power reference case at a fixed power of 150 Watts.  This is approximately 60% of my FTP, so it makes it a comfortable long-slow-ride kind of pace.

I ensured that that my ride was done at exactly 150W by using TrainerRoad in ERG mode to control my Wahoo Kickr trainer, ensuring that I held a power of exactly 150W, then linking the Kickr trainer to Zwift via it's second bluetooth connection so that the Zwift ride was done at 150W.  It can be seen in my Strava activity file (screenshot shown above, link to Strava activity here) that the power trace is constantly at 150W.

The entire Whole Lotta Lava route was done first, then I also performed most of a second lap too.  The second lap was useful because the translucent pace partner (which follows the pace of my best time) was a demonstration that Zwift was reproducing the pace almost exactly, as shown in the screenshot to the left.  This was the top of the climb, approximately half way through the route.  Note that the pace partner (riding at the pace of my previous lap) is very close to my avatar on the second lap.

This is to be expected, of course, but it was reassuring to see.  This is the kind of repeatability that would be impossible if riding a route outside!


Reference parameters

For the subsequent power delivery optimisation, I will also have to decide values to use for the following parameters:

  • Total weight (rider + bike)
  • CdA (drag coefficient x frontal area)
  • Crr (coefficient of rolling resistance)
  • Air pressure
  • Air temperature (which together with air pressure, gives the air density)
  • Drivetrain losses, if indeed Zwift even account for these.
The choice of these values should match as closely as possible as what Zwift models, some of which it's possible to determine, but some of which are unknown.

Weight
I entered my weight of 73kg and my height of 5'10" into Zwift.  I'm not sure what weight Zwift assumes for the bike, so this is something I had to figure out as part of the virtual elevation (VE) analysis.

Coefficient of rolling resistance (Crr)
According to Zwift Insider, Zwift assumes a Crr value of 0.004 for road and TT bikes on pavement.  I will use this 0.004 value for the VE analysis.  The small section of wooden boardwalk apparently pushes the Crr up to 0.0065 for that short period of time.

Drag coefficient (CdA)
Previously, when I unlocked the Zipp Super 9 disc wheel, I calculated (here) that the CdA was 0.2415 m^2.  I will use that value for VE analysis.

Air Pressure and Temperature
As I did previously, I assumed International Standard Atmospheric Sea Level conditions (101250 Pa, 15 degrees Celsius), which results in an air density of 1.225 kg/m3.  It's worth noting that pressure, temperature and the resulting air density only affects aerodynamic drag and nothing else.  Therefore, if the assumption is wrong, it will simply bias the CdA value which is also chosen, because it's the product of CdA and air density that affects aerodynamic drag.  As the CdA is obtained from the VE analysis, the choice of pressure, temperature and air density is rather arbitrary and intrinsically linked to the CdA value selection.

Drivetrain losses
I used a value of 2.5% as starting point, to be checked with the VE analysis.


Virtual Elevation Analysis

I used the .fit file from my Zwift ride to perform a virtual elevation analysis using Golden Cheetah's Aerolab Chung Analysis feature. The plot to the left shows the final fit between the real elevation curve (from Zwift, in green) and the Chung Method virtual elevation curve (in blue).  As can be seen in the plot, keeping the values above and changing only the total weight to 80kg gives an excellent fit between the blue and green curves, to the point where it's almost impossible to see the two different elevation profiles.  I also tried using other combinations of parameter values, but using this combination of parameter values gave the best match.


Summary and Results

My constant 150W ride took 27 minutes and 15 seconds to complete the Whole Lotta Lava route, which equates to an average speed of 16.8mph (27.0 kph).

My virtual analysis showed that the values used by Zwift which I need to use later for the power delivery optimisation are:

  • Total weight (rider + bike) = 80kg
  • CdA (drag coefficient x Frontal area) = 0.2415
  • Crr (coefficient of rolling resistance) = 0.004
  • Air pressure = 101,250 Pa
  • Air temperature = 15 degrees C
  • Air density = 1.225 kg/m^3
  • Drivetrain losses = 2.5%
I'll publish the next blog post to describe the improvements to my power delivery optimiser, once I've done that.


Friday, 29 December 2023

Validating My Power Delivery Optimiser: Introduction

In one of my earliest blog posts (here) from 2015, I described the power delivery optimiser that I created using Microsoft Excel.

I also used it to help a friend try to improve his personal best time for his favourite bike route (here). In doing so, I showed that my power delivery optimiser gave a similar optimal power profile to the profile that BestBikeSplit gave.

However, I have never properly validated my optimiser, or BestBikeSplit either, to prove that following those power targets does indeed give an improvement in performance.  It should do of course, because there is no reason why the modelling should have deficiencies.  Nevertheless, it would be satisfying to validate it properly, and this is what I intend to do in the coming weeks.

I have several steps in mind, because I also intend to improve my Excel-based power delivery optimiser so that it's generally easier to use.  This blog post is the first step, where I'll outline what I intend to do.  I'll then write additional blog posts as I make progress, and will update this post to include the relevant links.

The summary below describes briefly what I'll do and includes links to the more recent blog posts that will describe in more details the studies and the results.

Summary and links

  • Step 1:  Gathering data for the reference case (constant power).
  • Step 2:  Determine rider/bike parameters (CdA, Crr, weight).
  • Step 3:  Use BestBikeSplit to create an optimum power delivery profile.
  • [To be done] Step 4: Calculating the optimum power delivery profile using my optimiser.
  • [To be done] Step 5: Improve my power delivery optimiser.
  • [To be done] Step 6:  Calculate the optimum power profile for the route cycled in Step 1.  Do the same for BestBikeSpilt and compare.
  • [To be done] Step 7:  Re-ride the route following the optimum power profile, to see whether it improve the average speed versus the constant power approach done in Step 1.


Wednesday, 11 November 2020

Power delivery optimisation for a real-life cycling route


How to improve you average speed cycling
In a previous blog post (here) I described a power delivery optimisation analysis that I did back in 2016.  In that work I showed that, using a simple Excel-based optimiser, it's possible to make significant performance gains, a 2-3% improvement in that case, simply by optimising the power delivered during a bike ride for the same normalised power.  In other words, making the most of what you've got.  These improvements were the versus the 'baseline' situation where the ride was done at a fixed (not varying) power output with the same normalised power.  A 2-3% improvement may not sound like much, but to put this into context, that performance gain is equivalent to a 5% power improvement, for a fixed power delivery.  Alternatively, it's equivalent to a 5-6kg of weight loss, which is significant.

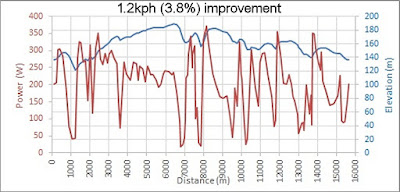
That study was done for a fictional 80km route having 1000m of elevation gain.  In 2020, a friend of mine, Steve, who's also an engineer, asked me if there was a better way for him to ride his favourite lunchtime cycle loop.  To give him some advice, I decided to try putting his bike route into my Excel optimiser to see what it would give.  By optimising his power, using the optimised power profile shown in the plot above, he could make an impressive 3.8% time saving and speed improvement, compared with riding the route at a fixed (constant) power.  This blog post describes that work in more detail.


Route setup

First I extracted my friend Steve's lunchtime route from Strava, as a GPX file.  That Strava output gave 276 waypoints on the route, with longitude, latitude and elevation data.

For my optimiser to work, I needed to reduce the number of points to 137 points, which is a number of segments that would be compatible with what Excel's optimiser can handle.

Steve's best time for this ride was 29 minutes, 42 seconds, which was an average speed of 31.8 kph.  I obtained a few other parameters from the  Strava file for his personal best time, then I needed to guess a few others:

Ambient temperature = 6 deg C  (from Strava)
Ambient Pressure = 101.25 Pa  (assumed)
Bike + Rider = 97.5 kg  (estimated)
Mechanical efficiency = 97.5%  (assumed)
No wind  (assumed)

Comparison with BestBikeSplit

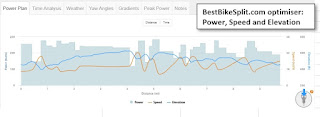
As a first check that my optimiser was doing something sensible, I compared the output with
BestBikeSplit.  BestBikeSplit does something very similar, so both methods should give reasonably similar results.  

BestBikeSplit assumed a rolling resistance coefficent (CRR) of 0.00622 and a CdA of 0.3424 [an explanation of CdA can be found here].  I
 used those two values in my own optimiser.  As can be seen from the plot on the left, both methods gave reasonably similar results for a normalised power of 239W:

BestBikeSplit: 29.8 kph average speed
My optimiser: 30.7 kph average speed

Qualitatively, the power distributions in those plots look similar.  The BestBikeSplit optimiser can split the route into only 50 segments, whereas my optimiser used 137 segments. This might be a reason why the average speeds differ slightly.  In any case, I was satisfied that this agreement was close enough.

Tuning CdA

I then tuned the value of CdA so that the optimised ride time was equal to Steve's best ride time.  Reducing CdA to 0.29 was enough to do this, to increase the average speed from 30.7 kph (for a CdA of 0.3424) to 31.8 kph for a CdA of 0.29.  A CdA value of 0.29 is a bit low for a recreational cyclist, in my experience, but Steve often rides with one of two colleagues, so 0.29 seems a reasonable value for his effective CdA, considering that some of the time he'd be riding in the draft of other people.

For this CdA of 0.29, and for a normalised power of 259.8W, I computed the "weighted average power" to be 241.0W and the average power to be 227.3W.

At this point I should note that the way in which Strava calculates weighted average power is not documented anywhere by Strava.  Weighted average values are generally higher than the average power values in my experience, but are always less than normalised power values.  Whereas normalised power is calculated by raising the power values to the power of 4, I assumed that weighted power is calculated by raising the power values to the power of 2.

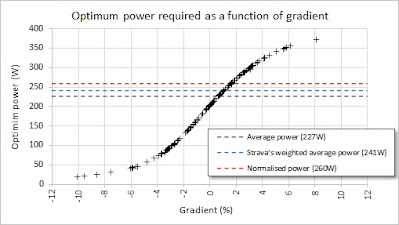
So to summarise, I now had an optimised power profile (see plot on the left) that produced an average speed that is identical to Steve's PB effort (31.8kph) using the same weighted average power as he produced in real life (241W).  Of course, it's highly unlikely that he would have ridden the route at the optimum power profile, but for the purposes of this study, to quantify the benefits of optimising power, I think that's good enough.  As an observation, it's interesting to see that the power needed to produce this optimised performance varies significantly, from about 20W on the steepest downhill part of the route (-10% gradient) to about 370W on the steepest uphill part of the route (+8% gradient).  Incidentally, the average power and normalised power for this power delivery is 227W and 260W respectively.

The improvement that the optimised power delivery achieves, versus the baseline case of a fixed, non-varying, power delivery can then be calculated by re-running my optimiser with an additional constraint.

How much faster is the optimised power delivery?

I re-ran the optimiser with weighted average power set to 241W, as before, but this time I also set an additional constraint that the average power had to be 241W too.  This additional average power constraint effectively prevented any significant variation in the power, meaning that the power delivery effectively became almost constant at 241W, as shown in the plot above.

The speed of this ride, if performed at this fixed power of 241W, would be 30.6 kph.  This is 1.2 kph slower (3.8% slower) than for the ride done at the optimised power delivery.

Comparison to other improvements

The significance of this 3.8% improvement is not so obvious, but can be put into context by calculating the effect of other improvements:

+10 Watts increase in weighted average power:            +0.7kph improvement (2.2% faster)
Butyl -> Latex inner tubes (-11% rolling resistance):      +0.3kph improvement (1.1% faster)
5 kg weight saving:                                                         +0.5kph improvement (1.5% faster)
Aero improvement through and aero helmet upgrade:   +0.2kph improvement (0.8% faster)

The speed improvements shown above make it clear how significant that 1.2kph (3.8%) improvement is from simply optimising the power delivery, applying the right amount of effort at the right time. 

Finally...

I was curious to see whether there is a relationship between optimum power and gradient.  Clearly, it's impractical, and will get kind of boring, to do this kind of analysis for every route that I might want to ride.  This work and previous work has shown that the optimiser determines that more power should be applied on the uphills, and less power on the downhills, but could there be a general rule? 

How to improve you average speed cycling
For the 137 segments of this route, I plotted on the left the optimum power versus the gradient.  It can be seen that the the points fall onto an smooth S-shaped trend line with no scatter.

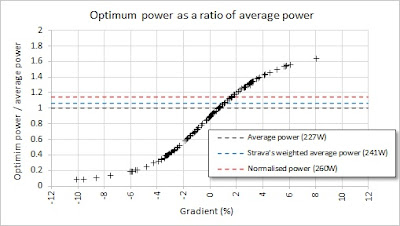
Perhaps more useful is the plot below, which is the same data but plotted as the ratio of the optimum power to the average power.  
How to improve you average speed cycling
So for example, you can see that for an uphill section of the route with a gradient of 5%, you should be cycling at a power that's approximately 50% higher than your average power.  Then, for a downhill section, having 5% gradient, you should be at 25% of your average power.

Obviously, this optimum delivery assumes that the riding conditions (traffic, corners, etc) do not limit the speeds, and that is one important caveat on all of this.  Also there is no consideration of what is achievable by a rider.  For example, if the average power is close to a rider's threshold, then they would only be able to hold those optimal higher power on uphill parts of the course for short periods of time.  The optimiser is simply finding the best power delivery profile for the prescribed average power.  In principle, additional physiological constraints could be put into the optimiser, but I haven't tried doing that yet.

As a next step, I'd like to see whether this optimum power relationship holds true for other bike routes and for other cases where there changes are made to either the riding conditions, the bike or the rider. 


Tuesday, 1 March 2016

What’s the fastest way to ride a cycling route?

This was was the first piece of cycling performance analysis that I did, back in 2016.  A few months before that, in late 2015, I had bought a power meter for my road bike.  I really liked the data that it provided, allowing me to pace my rides with more precision.  I quickly began to question, though, how should I pace a ride to achieve the fastest time, i.e. the highest average speed?  Should I try to keep my power constant, regardless of the terrain and wind conditions, or would it be quicker to increase the power on some sections of the route?  We often hear that for time trials the fastest time is achieved by holding the highest possible fixed power, instead of going 'too hard' at the start.  However, most time trials are held on flat routes, and I had a feeling that the constant power approach may not be best for hilly routes.

This is question is essentially an optimisation problem: What is the optimal way to deliver the power to minimise ride time (i.e. maximise average speed) for a set of constraints.  I decided to see whether Microsoft Excel's built-in optimiser could solve this kind of optimisation problem.

I should point out that, at this time, I wasn't aware of BestBikeSplit.com.  A couple of years after I did this work I heard about BestBikeSplit on the TrainerRoad podcast and discovered that it does something very similar to my Excel spreadsheet, albeit in a slicker commercial package.  In fact, I'm not sure which year BestBikeSplit was originally developed, but I wasn't aware of it when I developed this Excel-based bike power optimiser.  A future blog post will show comparisons between my my Excel optimiser and BestBikeSplit, showing that they both give similar optimisation results.


Bicycle Power Modelling

The starting point of my Excel based power optimiser was to build a model that calculates the required power to propel a bike.  The equations of motion that describe the forces on a bike, and hence the power required to move it, are shown below.

This is another situation where I derived something myself, the equations below, and then some years later discovered that this model of the forces acting on a bicycle had been derived previously (not surprisingly). See here for Jim Martin's paper.


Power = (Fa + Fg + Fr + Fi)*V

   Where:

   Fa = Aerodynamic drag force (N)
   Fg = Gravitational component force (N)
   Fr = Rolling resistance force (N)
   Fi = Inertia force (N)
   V = Velocity (m/s)

   and:

   CdA = Drag area of the bike+rider (m^2)
   Cr = Coefficient of rolling resistance
   rho = Air density (kg/m^3)
   m = Mass of bike+rider (kg)
   t = time (s)
  g = Acceleration due to gravity (=9.81m/s^2)  

This power model was validated by comparing the power predicted by this model against the measured powers that I recorded during three Strava segments; 2 flat segments and an uphill segment:


1) Weston Hill, near Bath, South West England:

https://www.strava.com/segments/6665281 : 1.578 km, 10.3% gradient.
Real life: 18/07/15, 7 mins 35 secs (8.0 mph),  20 degC,  80.6 kg, 313 W average power
Model:  8.0 mph gives a power requirement of 314W using CdA=0.36m^2, Cr=0.0045
-> +1W (+0.3%) discrepancy


2) U102 out and back time trial segments, near Bristol: 

Real life: 18/08/15, 8 mins 32 secs (24.5mph),  17 degC,  80 kg, 2 mph estimated tailwind, 267 W average power
Model:  24.5 mph (with 2 mph tailwind) gives a power requirement of 273 W using CdA=0.36m^2, Cr=0.0045
-> +6W (+2.2%) discrepancy

Real life: 18/08/15, 13 mins 1 secs (21.3mph),  17 degC,  80 kg, 2 mph estimated headwind, 267 W average power
Model:  21.3 mph (with 2mph headwind) gives a power requirement of 260W using CdA=0.36m^2, Cr=0.0045
-> -7W (-2.7 %) discrepancy

The agreement between the model and measured (real life) powers agree within a few percent.  For the hilly segment, the model predicts the power requirement very well (a 1W or 0.3% discrepancy).  For the two flat segments, the model overpredicts the power requirement for the 'out' leg of the TT course and and underpredicts it for the return leg, due to the estimated wind effects.  If I were to tweak the headwind by just 0.3 mph (bearing in mind that I had to guess the headwind speed of 2 mph) then the model is spot on, within a few tenths of a percent for both out and return legs. Therefore, it can be concluded that overall the model and the values selected for CdA and Crr (drag area and coefficient of rolling resistance, 0.36m^2 and 0.0045 respectively) accurately simulate real life riding.

This model validation step was an important precursor to any subsequent use of the model for further investigations, as described in the next section.


Optimal power delivery

My Excel-based power model simulates a bike ride by splitting it up into several 'segments'. For each segment, which has a specified distance and gradient, the speed is set either by the user or by the Excel optimiser.  Then, the model calculates the power for each segment for the chosen speeds, assuming steady-state conditions.  Essentially, this neglects speed and acceleration transients between segments, which I understand is the same assumption made also by BestBikeSplit.

The powers for all of the segments can be time-averaged to calculate the overall average power for the ride, and this is the result that the optimiser is trying to minimise (or to look at it another way, it tries to maximise the average speed for a fixed average power).

I also included an approximate estimate for normalised power, since it's often that case that normalised power is the metric that we want to minimise or control instead of average power, to reflect the physiological cost of the ride.  My spreadsheet calculates only approximate normalised power though, because instead of using the 30-second average power to derive normalised power, it effectively uses 1-second power.  This is not too much of an issue, though, because most segments I used for these studies were much longer than 30 seconds, so there were no short segments where the time would be less that 30 seconds, where the normalised power calculation would have been significantly impacted.  Therefore, the approximate calculation of normalised power is fit for purpose.

The optimiser can be used to either target an average power number or a normalised power number, whichever is preferred.  In the subsequent example I chose to target a given normalised power.


Routes for optimiser

I created three fictional routes, to see how the optimised power would differ for different types of rides:

Route 1: Typical short/medium sportive - 80km route, 1000m of climbing, 200W normalised power.

Route 2: 40km TT - 40km perfectly flat route, 250W normalised power.

Route 3: Hilly route: 40km route with 900m of climbing, 250W normalised power


The profile for Route 1 (80km, 1000m of climbing) is shown below:


The profile for Route 3 (40km, 900m of climbing) is shown below:


Results: Constant power versus optimised power

For Route 1 (80km, 1000m climbing), the optimised power profile, targeting 200W normalised power is shown below (upper chart), compared with the fixed power profile (lower chart).  It is clear the that optimiser has determined that it is optimal to increase the power when ascending hills and reduce the power when descending hills.

Optimum power delivery on a bike


                                 Average Power        Normalised Power             Time                  Improvement
Constant Power                  200.0 W                     200.0 W                 2 hrs 54.6 mins                  -
Optimised Power                192.6 W                     200.0 W                 2 hrs 51.1 mins                2.0%


An optimised power delivery achieves a 2.0% improvement (three and a half minutes) for the same normalised power of 200W.  Note that the same normalised power means the optimised power delivery has a 7.4W lower average power, at 192.6W.  Since it has the same normalised power and a lower average power, the optimised power profile would I think not only be faster, but would feel similar or easier than the constant power profile.


For Route 2 (40km, perfectly flat route), the optimised power profile, targeting 250W normalised power is exactly the same as the constant power profile, i.e. it is optimal to ride at at a fixed power of 250W.  This is not surprising, because the optimum power profile is a result of changes to the riding conditions. No changes in terrain or wind mean the optimum is a constant power profile.  If the terrain or wind were to change along the route, the optimal power at any particular point in a ride would change also, as can be seen for Route 1 above and Route 3 below.


For Route 3 (Hilly route: 40km route with 900m of climbing), the optimised power profile, targeting 250W normalised power is shown below (upper chart), compared with the fixed power profile (lower chart).  As for Route 1, the optimiser has again determined that it is optimal to increase the power when ascending hills and reduce the power when descending hills.

Optimum power profile on a bike


                                 Average Power        Normalised Power              Time                  Improvement
Constant Power                  250.0 W                     250.0 W                 1 hr 30.0 mins                  -
Optimised Power                237.5 W                     250.0 W                 1 hr 27.6 mins                2.7%
'Too hard' power                 224.7 W                     250.0 W                 1 hr 28.0 mins                2.2%


As for Route 1, the optimised power delivery achieves a significant improvement for the same normalised power.  In this case, the improvement is slightly more than for Route 1, at 2.7%.  Again, this improvement is achieved by pushing slightly harder on the climbs and then backing off slightly on the descents.

What happens, though, if you push even harder on the hills (labelled the "Too hard" case above)?  I took the optimised power profile shown in the plot above and increased the amplitude of the speed variation (fixed power versus optimised power) by 50%, then made a 0.2 mph global adjustment to the speed to keep the normalised power at exactly 250W.  For example, for the steep 10% gradient climb in the middle of the route, the climb is done at 6.64 mph for the constant 250W power profile,  7.48 mph at the optimum power of 283W, and 7.72 mph at the 'too hard' power of 293W.


The overall result is a ride time that's still better than the constant power approach, but is worse than for the optimum power profile. This also is a useful quick-and-dirty check that the optimiser is working as intended.  The very subtle differences in the chosen powers for the 'optimum' and 'too hard' power profiles (283W vs 293W) shows that it's difficult to select the optimum power based on guesswork alone, and it's easy to go too hard on hills. Anecdotally, this is something I see a lot of recreational riders doing on sportives, riding overly hard on the climbs.


Conclusion

My Excel-based power optimiser uses fairly simple modelling of the forces acting on a bike to estimate the required power for a given speed. This model has been validated based on real-life rides and measured power data.

The optimiser can determine the optimum (best) use of a person's power for any cycle route. The results show that improvement in time and average speed can be made by pushing harder (above average or normalised power) on the climbs and easing off on the descents (below avg or normalised power). This tends to be what riders do naturally when riding, but the optimisatiosn studies have also shown that it's difficult to judge how much harder and easier those power variations should be to achieve the best (optimum) ride.

The optimum power profile provides a significant performance improvement compared with a constant power approach.  2-3% improvements are possible, which may not sound like large improvements, but a 2-3% improvement is equivalent to about 5% power improvement, or a huge 5-6kg weight saving*.

* A future blog post will show these effects and the best way to spend your money on bike improvements.  In fact, this power optimisation model was a precursor for doing those best-bang-for-your-buck studies.


Finally:  Observant people will notice that that my power modelling doesn't have a correction for transmission losses, so it implicitly models a perfectly efficient transmission, or the power required at the rear hub, not power at the pedals. This was an oversight on my part. However, although it will affect the absolute predicted powers/speeds and therefore the CdA and CRR tuning, I don't believe it will affect the overall conclusions of this study.