This blog is a repository for all my the bike-related studies over the past 20+ years. The content ranges from modelling and analytical studies, to hacks and bodges made to my bike equipment. It's all been done in an attempt to make myself faster on a bike, to make the most of my mediocre fitness.
Blog posts have been written from 2020 onwards. The dates of the posts reflect when the work was originally done.
It’s almost complete now, with just a few older posts still to write up.
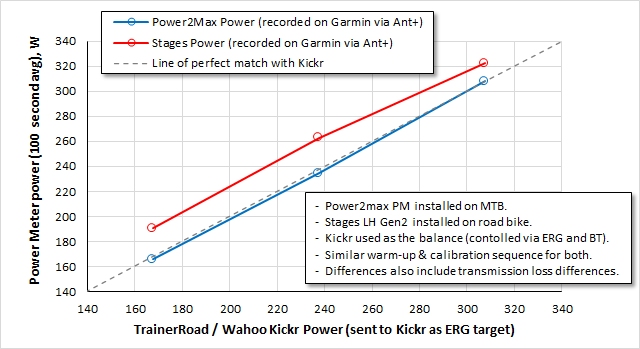
I will make this a short blog post, because the chart to the left speaks for itself.
Finally, after about 4 years of using exclusivelysingle sided poer meters on my bikes (Stages left hand crank-based PMs), I decided to buy myself a dual-sided power meter. This new power meter was to be fitted onto my hardtail mountain bike, a Scott Scale, which until now never had a power meter installed on it.
After some research, I decided to by a Power2max NG-eco spider-based power meter. Strictly speaking, this measures total power, rather than both sides because the strain gauge measurements in the crank spider aren't able to differentiate whether the measured torque is coming from the left or the right side.
Before test riding my mountain bike with Power2Max power meter installed on it, I was keen to first check how its readings compared to the 2nd generation Stages power meter installed on my road bike, which I use for the majority of my training.
Unfortunately, it wasn't possible to fit both power meters on the same bike, because the the Stages Shimano 105 left hand crank arm wasn't compatible with the XTR crankset on my MTB, with the splines being different. Instead, I used a technique I've used previously (described here) to compare power meters, whereby I used my Wahoo Kickr trainer as the 'balance'.
The method involves testing one bike, then the other, on the Kickr, with the Kickr target (ERG) power profile controlled via an app using Bluetooth, in my case the TrainerRoad app. The actual power meter measurements are then recorded via ANT+ on my Garmin head unit.
The plot to the left shows the power meter readings versus time for the same Wahoo Kickr power profile.
It's clear that the Stages power meter reads significantly higher that the Wahoo Kickr power, whereas the Power2max power meter tracks very closely with the Wahoo Kickr. The plot at the top of the page shows the average power over 100 seconds for each interval. The Stages power meter reads between 15-25 Watts higher than the Kickr (5-14%), whereas the Power2max power meter is within 2-3 Watts.
There's no way to say for sure which power measurement is closest to 'the truth', but given that two power measurements match very well and the odd one out is a single-sided power meter, I think it's highly likely that the Stages power meter is the wrong one out of the three.
I think it's most likely that my left/right leg balance isn't 50/50, which is an assumption that the Stages power meter makes in it's calculation of total power from the left-hand power measurement. A leg/right balance of 55/45, for example, would result in a 10% over-estimation of power by the Stages.
A few months ago, Bicycle Rolling Resistance (BRR) tested the latest version of Schwalbe's Thunder Burt with the 2.25" Super Ground casing (see results here). It performed really well, narrowly beating the previous best mountain bike tyre, the 2.2" Continental Race King Protection (see results here).
As BRR said in it's conclusion: "The current generation has moved to Schwalbe's Super casings with a Super Ground and Super Race version available in several sizes. As the name suggests, the Super Race should be a bit faster than the Super Ground, while the Super Ground offers a bit more protection"
"...It looks like the Super Race version of the Thunder Burt is racking up quite a few votes and has a good chance of being tested in the near future as well."
Sadly though, the Super Race version of the Thunder Burt never made it to the top of the voting list and it expired from the list last month. I was a little disappointed by this, but I decided to buy a pair of those tyres anyway, particularly as I have an upcoming beach race in April that the Thunder Burt tread is perfect for. However, I wanted to test them first, to check how they performed against the Continental Race King Protection that I already own and have installed on the back of my MTB.
Equipment and test setup
I used my roller method for this testing, which I've described recently in previousblog posts.
The testing wasn't particularly straight-forward though, because my mountain bike doesn't have a power meter. I only have power meters on my road bike, my cyclocross/gravel bike and my time trial bike. Those are all Shimano Stages left hand crank-based power meters. My mountain bike has a SRAM GXP mountain bike chainset, so the chainset isn't at all compatible with those power meters.
My solution was to use my commuting bike instead, which has a Shimano crankset and bottom bracket, albeit a MTB chainset instead of a road chainset. Road and MTB chainsets are not compatible though, having different axle lengths and Q-factors.
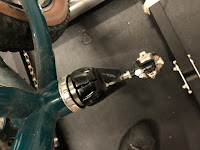
This meant the chainset axle was too long for the Stages 105 left-hand crank arm that I tried to fit on it. It did fit on the hollowtech tech splined axle, both having the same diameter and splines, but it left a gap between the crank arm and the bottom bracket cups. I needed a 5-6mm spacer or washer to fill the gap. I found that a spare set of axle cartridge bearings filled the gap perfectly (see photo above). This was a bodge, but it worked really well. As a result, I got my Shimano 105 power meter successfully working on the left hand side of my Shimano SLX chainset.
A bit more faffing was required to do the testing though: I had to remove my SKS mudguards, which rubbed on the large knobbly mountain bike tyres, and I changed the pedals to my good clipless SPDs too. All in all, it took a fair amount of time before I could get started.
I chose to do the testing with a lightweight (150g) butyl inner tube, just to save the time and mess associated with a tubeless set up. Since I was interested in which tyre was fastest, this approach was fine, because both tyres would be subject to the same additional losses from having the inner tube installed. Furthermore, doing the testing with an inner tube allowed a better comparison with the BRR data, which also used a butyl inner tube for their testing, albeit a heavier-weight inner tube.
Results
The plot below show how the the two tyres compare. I had enough time to repeat the testing for the Thunder Burts, after testing the Continental Race King, to confirm that Thunder Burts really does give lower CRR numbers. Since the two blocks of testing with the Thunder Burts were before and after the testing with the Race King, then I can be fairly confident the Thunder Burts are a better tyre, despite the imperfect repeatability seen in the plot below.
The differences aren't massive, and correspond to only 2-3 Watts at 25 kph, but it's a benefit worth having. Something to be noted is that the Thunder Burts were slightly larger than the Race King, at 2.35" width versus 2.2". In addition, the Thunder Burt was brand new, whereas the Race King was one or two years old and has some Stans sealant residue on the inside. This latter point might be a source of additional losses, I'm not sure, but in any case, the purpose of this exercise was to compare these two tyres ahead of my upcoming race, so these old and used tyres are the ones I would have chosen from anyway.
Finally, it's worth noting that the agreement with Bicycle Rolling Resistance data is remarkably good at the interface of the two sets of data. However, this might be a fluke.
The previous foam tyre insert testing I did (see previous blog post here) gave some interesting and surprising results. I was expecting the foam tyre inserts to cause a small rolling resistance penalty, especially at very low tyre pressures of around 15 psi. However, they didn't. The effect of the foam tyre inserts on CRR (coefficient of rolling resistance) was within the precision of what could be measured in the test, so the effect was very small or nothing. The results are re-shown in the plot below (the green symbols versus the blue symbols).
This surprising result got me thinking about the causes. Why don't the foam tyre inserts have an effect on rolling resistance? At low tyre pressures, the compression of the foam insert at the contact patch should generate hysteretic losses that manifest themselves as additional rolling resistance. Why is that not seen? It got me thinking.
One possible explanation, and one that I mentioned at the end of my previous post, was that the ends of the inserts were (unintentionally) not connected when I did the testing, so the foam insert was 'free floating' in the tyre cavity, rather than held tight against the rim. This is a plausible explanation for an absence of any effect at higher pressures. However, I would still expect the foam insert to get compressed at 15 psi, when the tyre drop (the squish) should have been enough to compress the foam insert.
There is a second possible explanation for this observation, though, for the lack of a measurable effect of the tyre inserts. I remembered that when Vittoria launched their Air Liner Road tyre insert for road bikes, they explained that their inserts compress into the rim bead when the tyre is inflated, because the foam is closed-cell foam. The effect of the tyre pressure on the Vittoria Air Liner was demonstrated nicely in their video below:
This is the reason why the effect of the Vittoria Air Liner on tyre rolling resistance measurements was negligible when it was tested by Bicycle Rolling Resistance here. It might be the same reason why Aerocoach reached the same conclusion, but for the Tubolight Road insert in their rolling resistance testing here.
Could the same thing be happening for my gravel/cyclocross tyre inserts, that they are shrinking when the tyres are inflated? I didn't even know whether the foam inserts were constructed from closed-cell foam or not.
I decided to do an experiment to find out. The method and results are shown in the YouTube video below:
Results
So, the answer is a YES, they do shrink, and quite a lot!
It confirms that my budget Planet X foam inserts are indeed made from closed-cell foam, and so they were subject to the same compression mechanism as the Vittoria Air Liner Road tyre insert. The picture to the left shows the cross section of the tyre insert as the pressure is raised from zero to 34 psi. At 34 psi, the insert has shrunk to about a third of it's original size. At 15 psi, it would have been approximately half it's original size.
So finally, this is plausible explanation, and the most likely reason why I saw no effect on rolling resistance when I tested at 15 psi: The tyre insert had already shrunk enough that it wasn't actually getting compressed at the tyre contact patch on the rollers.
Do tyre insert companies know this happens?
We know that Vittoria have figured this out, but what about other tyre insert companies? I'm not convinced they have.
If I look at some of the promotional pictures on the websites of the various companies selling foam tyre inserts, I get the impression they don't realise this compression is happening. For example, I have shown on the left a few pictures taken from some of the company's websites. These all show the foam tyre inserts inside the tyres rolling over objects, but the inserts are the same size and shape as their pre-inflated size.
Either the tyre insert companies don't realise what's going on, or they are trying to mislead people.
It could be argued however, that this doesn't matter, and that it's the performance of the tyre inserts that matters. I would agree with that, and the testing done by PinkBike shows that these tyre inserts do still work (for rim protection), regardless of them probably shrinking when the tyre is inflated.
However, I think it's still important to understand what size and shape the insert becomes when it's inside the inflated tyre. For example, is it still going to be wide enough to cushion and protect the rim flanks, or will the insert become too small for that, and instead get pushed down into the rim well and central channel? That will affect how impact loads are taken by the rim structure.
What many of these companies show is happening, and possibly what they thinkis happening, inside the tyre is probably not what's actually happening. It will depend on the construction of the tyre insert though, and how much air is contained in the tyre insert material. Nevertheless, what's important is to check what size and shape the insert becomes when it's inside an inflated tyre. Apart from Vittoria, I haven't seen other companies address this.
The physics behind what's happening
This final section may not be interesting to many people, but as an addendum, I can explain why a closed cell foam tyre insert shrinks when the tyre is compressed.
My foam tyre insert has a volume of around 1280 cubic centimetres and weighs 34g. That means its density is 26.6 kg per metre cubed, which shows that most of that volume is air; air inside the closed cells of the foam. In view of the density value, I would guess that more than 95% of it is air.
Before installing the tyre insert, the pressure outside and inside the foam insert is at atmospheric pressure, which is 14.7 psi at sea level. When the pressure outside of the foam insert increases, however, as happens when the tyre is inflated, that external pressure causes the air cells inside the foam to compress to the same pressure. This is the same principle as when you sit your 80kg backside on a chair: The chair and floor has to push upwards with a force of 80kg.
The volume of the air cells reduces under this increase pressure, as dictated by Boyle's law. Boyle's law says that the volume of a gas (air in this case) is inversely proportional to pressure, for a fixed mass and temperature of gas. This means that if the pressure doubles, then the volume must half.
For our particular application, a doubling of the pressure means putting 15 psi into the tyres, because remember, the pressure started at one atmosphere, which is about 15 psi.
And what happens if 15 psi is applied? The volume of the foam tyre insert approximately halves, as shown on the left. This is a good demonstration of Boyle's law. Another demonstration of Boyle's law, very similar to this, can be found here, which is the link on the Wikipedia page.
People very familiar with these gas laws may already realise that for the case rapid inflation or deflation, as shown in my video, the expansion is not strictly following Boyle's Law. This is because Boyle's law assumes an isothermal (constant temperature) expansion or compression. A rapid expansion or compression is an adiabatic process (no heat transfer) instead of an isothermal one, and is therefore subject the Ideal Gas Law instead, which considers temperature changes on pressure and volume (whereas Boyle's Law assumes temperature is fixed). In the case of a tyre being quickly inflated, if the pressure is doubled, the volume won't be halved but will be 61% instead. This 0.61 value come from 0.5 raised to the power of (1/gamma), where gamma is the specific heat ratio for air, which is 1.4.
What's important though is what volume the foam tyre insert will be when it's in the inflated tyre being ridden. In that case, the foam insert and the tyre will have reached thermal equilibrium after half an hour or so, so in all practical riding cases, where tyres would have been inflated in advance of the ride, thermal equilibrium would have been reached, and so Boyle's law is appropriate.
I've worked in the aerodynamics department of a large aircraft manufacturer for over 20 years. In my day job, I'm responsible for the prediction, modelling and measurement of the drag and lift of our aircraft. Much of my interest and knowledge of engineering and aerodynamics spills over into my main hobby, which is cycling (Road, MTB, cyclocross and time trialing).