- With no power meter installed, I warmed up the smart trainer for 15 minutes at 140-170 Watts.
- The smart trainer was then calibrated. No further re-calibration of the trainer was done.
Then, for each of the three power meters, the following was done:
- Install the first power meter. LH crank bolts tightened to 12Nm.
- Power meter calibrated (zero offset) via the Stages app.
- Collected power data at the first power setting, 150W:
- Use TrainerRoad app to set the smart trainer target power to 150W in ERG mode.
- Pedal for 1 minute to allow everything to stabilise.
- Press the lap button, and pedal for a further 2 minutes to collect power data.
- Record the average power from the power meter (Garmin) over the two minutes.
- Collect power data at second power setting, 215W, using the same steps.
- Collect power data at third power setting, 280W, using the same steps.
- Optional: Collect repeat power data at 215W and 150W if time, energy, and motivation permit.
The order of testing the power meters was:
1) Stages Shimano 105 7000 Gen 3 power meter
2) Stages Shimano 105 5800 Gen 2 power meter
3) Stages Shimano Ultegra 6700 Gen 1 power meter
4) A fourth run was done with a repeat of (1), the 105 7000 Gen 3 power meter, to check the repeatability after a PM re-installation.
Results
Repeatability
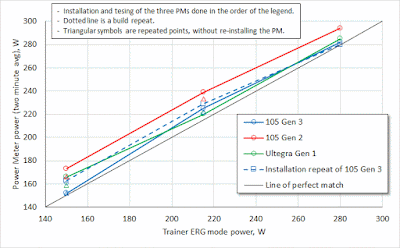
You can see from the plot above, that there's a fair amount of variation seen in the results, not just between the three power meters but also some significant changes seen in the repeats. Ideally, the repeats should be very close to the first recordings, so what can we learn from this?
Starting with the repeats, the installation repeat run gave some differences of 2-11 Watts between run (1) and run (4) for the same power meter. There are several possible explanations for this difference that I can think of:
Explanation 1) The Stages power meter calibration drifted between runs 1 and 4. This is unlikely because both runs were done with exactly the same protocol, so there is no additional usage of the PM that should cause a drift. For example, it was no warmer on the 4th run, having been inactive for 45-60 minutes. Also, the differences between the powers are not consistent across the range, so it's not a parallel offset that would otherwise indicate a calibration drift.
Explanation 2) The Wahoo Smart trainer has drifted. Again, I think this is unlikely because if this were true, I'd again expect a constant parallel offset to be seen between runs 1 and 4.
Explanation 3) The most likely hypothesis is, I think, that both runs are subject to small changes in my left/right leg balance, with random changes affecting the results. For example, if at 150W I have a 48/52% left/right leg split, then the left leg produces 72W, the right leg produces 78W to create the 150W (real) power total. However, the Stages PM always assumes the right leg also produces the same as the left, 72W, so the Stages PM would give a total power of 144W. If that L/R balance then swings by 4% to 52/48% L/R instead, then the left leg produces 78W, the right leg produces 72W, but the Stages PM gives a total power of 156W. So a swing of 2% asymmetry to the left, to 2% assymmetry to the right, will create an apparent power difference of 12W for the same actual 150W power total in both cases. If the target power is higher, say 280W, that same swing would be higher, 22.4W.
I think this is third explanation, of random small changes to the L/R leg imbalance, is the most plausible explanation of the 2-11 Watt variation seen in the installation repeat. It also explains why similarly large differences are seen in the repeats that were done before uninstalling each power meter (step 6 in the method).
Power meter differences
The differences between the power meter results has to be considered with a view of these repeatability results. However, even considering the repeatability, and the uncertainty that it introduces, I feel the Gen 2 105 power meter (the red data points) is reading higher that the other two PMs. Although its difficult to be conclusive, I would say the the Gen 2 105 PM is reading around 10-Watts higher than the other two.
This isn't a huge difference, but it is large enough that I'll need to take it into consideration when riding close to my limit, close to threshold. This Gen 3 105 PM will go onto my gravel bike, with the Gen 2 staying on my Road bike, which I use for most training, FTP tests etc. I will therefore have to keep in mind that the power values on my gravel bike may read a little low compared with what I am used to on my road bike, for the same effort level.


