How much slower is a gravel bike than a road bike, on the road? How much slower is a mountain bike than a gravel bike?
These are the questions I tried to answer with a quick test I did yesterday afternoon. The results were a little surprising...
The Bikes
Road Bike

A road bike from Planet X.
It has 50mm deep carbon wheels. The tyres are fast road bike tyres: Continental GP5000s with latex inner tubes.
Tyres were inflated to 80 psi.
It weighs around 7kg.
Gravel Bike
A titanium cyclocross bike from Planet X.It's fitted with fairly fast small-knobbed gravel tyres (hence I'm calling it the "gravel bike"). The tyres are 43mm Panaracer GravelKing SK TLCs, run tubeless.
Tyres were inflated to 25 psi.
It weighs around 9kg.
Mountain Bike
A Scott hardtail.On the front, it's fitted with a 2.25" Schwalbe Rocket Ron Snakeskin Addix Speed tyre. On the back, it has a 2.2" Continental Race King Protection tyre. Both are tubeless. These are both fast XC tyres.
Tyres were inflated to 22 psi.
It weighs around 9kg.
Clothing / Kit
For all three bikes, I wore the same road bike style kit, a tight fitting jersey and lycra shorts, base layer, standard helmet. The same two bottles were used on all of the bikes.
Test Method
I rode the same 8 mile road circuit on all three bike, back-to-back during a 2 hour window. It was fairly flat, with only 80m of climbing over those 8 miles. I started with the road bike, then the gravel bike, then the MTB.
I recorded the speed on 7.5 mile stretch that was fairly uninterrupted. There was one set of traffic lights, at mile 5, where I had to stop the Garmin and re-start it. My average speeds that I extracted from Strava are not affected by the length of the stoppage at the lights. Speed and position data was from GPS.
I tried to ensure a consistent effort on all three bike. The road and gravel bikes both have Stages power meters. My previously power meter cross-calibration work showed that my road bike power meter over-reads by about 10W relative to my gravel bike's power meter. Hence I targeted 250W for the road bike and 240W as the target for the gravel bike.
My mountain bike doesn't have a power meter, so I had to go off feel, targeting the same rate of perceived exertion as for the other two. I did however, have a heart rate monitor, and although I wasn't monitoring my HR during the test, my HR was close between all three bikes (Road Bike:160bpm, Gravel:157bpm, MTB:156bpm). As a result, I was fairly satisfied that my effort and power was similar on all three bikes.
The geometry and position on the bikes is obviously different. I chose to ride all three bikes in the style and position I would normally chose for riding each of those bikes. Therefore, for the road bike, I was most stretched out and had the lowest torso. I was most upright for the MTB. For the gravel bike, I was in between the other two.
Results
As mentioned in the intro, the results were a little surprising:
Road Bike: 20.2 mph / 32.5 kph, 245W average
Gravel Bike: 18.5 mph / 29.8 kph, 239W average (=249W with +10W correction)
MTB: 18.6 mph / 29.9 kph
So the Gravel bike was 8.5% slower than the road bike, which is close to what I expected. The real surprise, though, is how fast the MTB was relative to the other two, and that it was marginally faster than the gravel bike!
Analysis
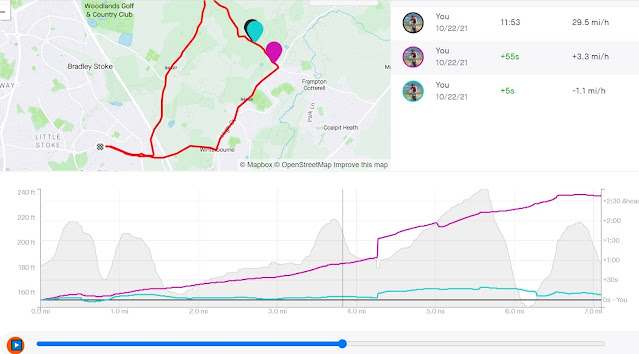
I created a segment in Strava, and used the Strava comparison feature to see how all three compared:
Gravel = Black (the reference), Road Bike = pinky purple, MTB = blue
Looking at this plot, it's clear that the road bike gains time on the other two everywhere. Ignore the steps at ~4.3 miles, which is the traffic lights. Stopping at the traffic light affects the segment times, which is based on clock time, but it doesn't affect the average speed, because I stopped my Garmin and is therefore based on time moving.
Then, the plot shows the MTB seems to gain time slightly on the uphill sections and lose time on the downhill sections. The time losses on the faster downhill sections make sense, because the MTB and my position on the MTB is obviously less aerodynamic than the other two bikes.
It was strange, though, that it gained time on the gravel bike on the slower uphill sections. The two are similar in their weight. Could it be the rolling resistance? Both gravel and MTB tyres were reasonably fast tyres, but the gravel bike tyres look like they should be faster.
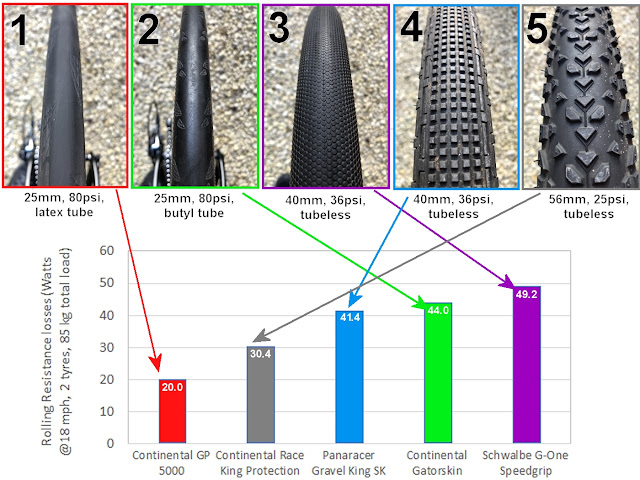
To check this, I looked at the rolling resistance data on the Bicycle Rolling Resistance website, which is an excellent resource that I use to help me choose tyres. I was familiar with rolling resistance data for all my sets of tyres, versus alternative choices in their categories, but I'd never compared the rolling resistance of gravel and MTB tyres against each other. To my surprise, the MTB tyres are actually lower rolling resistance that the gravel tyres:
Gravel Tyres: 56.6W @27psi, 49.4W @36psi -> 65.4W at the 25psi pressure ridden
-8W adjustment for tubeless setup -> 57.4W at the 25psi pressure ridden
MTB Front tyre: 48.6W @35psi, 53.4W @25psi -> 59.6W at the 22psi pressure ridden
MTB Rear tyre: 36.0W @35psi, 40.4W @25psi -> 46.1W at the 22psi pressure ridden
MTB average: 52.8W assuming 50/50 front/rear weight split (for simplicity)
-10W adjustment for tubeless setup -> 42.8W at the 22psi pressure ridden
All power values above are for two tyres at 85kg load at 18mph, which is quite close to my test conditions. The GravelKing tyre data was for 38mm version, but recent testing on the BicycleRollingResistance website has shown that the performance difference between 35mm and 40mm versions of the GravelKing TLC is very similar, so using the data from the 38mm version is good enough I think. Both rolling resistance numbers have been adjusted based for tubeless a tubeless set-up, because the standard testing uses butyl inner tubes. The MTB tyre power number was reduced by 10W, based on this BicycleRollingResistance data. The gravel tyre power number was reduced by an estimated 8W, estimated by looking at how latex tube versus butyl tubes affected the MTB and road bike power numbers.
Something to note is that I am running foam tyre inserts in my Gravel tyres, although I took care to ensure the tyre inserts are not contacting the tyre and getting compressed at the contact patch (and with some margin to spare), to ensure the tyre inserts don't affect rolling resistance.
For reference, the road bike tyres are much lower rolling resistance than both the gravel and MTB tyres:
Road Bike tyres: 20.0W for a GP5000 with latex tubes at 80 psi, i.e. a 23-37 Watt advantage over both the MTB and gravel bike tyres.
Discussion & Conclusion
The results surprised me, but upon closer inspection it's clear that the MTB has an (unexpected) 14.6 Watt rolling resistance advantage of the gravel bike. This seems to have an beneficial effect at the slower speeds, when the aerodynamic disadvantages of the MTB are less dominant, and overall it gave the MTB a marginally higher speed one the 7.5 mile road route.
We have to keep in mind that the MTB did not have a power meter, but nevertheless I took care not to go 'too hard' on the MTB, by riding that bike last (when I was most fatigued), and by checking my heart rate data after the ride, to ensure it was not higher than for the other two bikes.
This leads me to now wonder: If my gravel bike isn't faster than the MTB on a flat-ish road route, in what situation would the gravel bike be better than the MTB, if any??
 speed comparison")