Monday, 21 February 2022

Do foam tyre inserts degrade rolling resistance?

Do foam tyre inserts affect the rolling resistance of a tyre?  Based on this testing then the answer is no, probably not.

If there is a penalty at all, then it's very small, at least for the tyre inserts that I tested.  Read on for more details...

Why I've been using tyre inserts

About two years ago I tested the effect of tyre pressure on rolling resistance, using my Cyclocross/Gravel bike ridden on a grass field.  That test used the Virtual Elevation (VE) outdoor method.  The tyres I used were 35mm Schwalbe X-One Allround tyres.  The results were explained in my previous blog post here.

Those results from 2020, shown in the plot on the left, really surprised me because there was no 'optimum' tyre pressure.  The red points continue the downward CRR (rolling resistance coefficient) trend towards the left hand side of the plot, for lower pressures.  I was expecting there to be an optimum pressure somewhere, that gave the minimum rolling resistance.  However, the testing showed that lower tyre pressures were always best, even at pressures so low that the tyre became laterally unstable.  Rolling resistance expert Tom Anhalt commented on a forum that other people had found similar similar results to this in the past, for MTB tyres, finding also that lower pressure was best for rolling resistance.

After this testing, I began to run lower pressures on my cyclocross bike, to exploit these rolling resistance advantages, and in doing so also gained some comfort and grip benefits.  The potential problem with running lower tyre pressures though, as all mountain bike and cyclocross riders will know only too well, is an increased risk of rim damage and pinch flats if you hit a sharp object.

Indeed, several weeks later, while I was out on a ride I double-flatted my tubeless Schwalbe X-One tyres after hitting a concealed rock.  One tyre was punctured so badly that it struggled to hold air, even with tubeless 'bacon' repair strips inserted into the tyre hole.  I just about made it back home.  One of the tyres was badly damaged and had to be thrown away.

My motivation for using foam tyre inserts, then, was to allow me to run lower pressures, to take advantage of the rolling resistance benefits shown in the plot above, but reducing the risk of rim damage and pinch flats.

I have been using foam tyre inserts for almost two years now on my cyclocross/gravel bike.  Although I've been generally very happy with them, I've always wondered in the back of my mind whether I'm paying a rolling resistance penalty by using the foam inserts. If it's a large penalty, it might actually cancel out the benefit of running lower pressures.  That's why I wanted to do this testing.


Available Data

As far as I'm aware, there has been very little testing of rolling resistance done and published for the commercially available tyre inserts, which is a shame, and this is the reason I've done this testing.

Testing of tyre inserts, especially for mountain bike applications, usually involves only a qualitative assessment of the effect of tyre inserts on the ride feel, tyre stability, tyre damping and rim protection.  Some quantitative testing was done by Pink Bike last year, but that testing was limited to evaluating rim impact protection only.

Testing of road tyre inserts has been done by Aerocoach and Bicycle Rolling Resistance, both concluding minimal impact on rolling resistance, but tyre liners for road tyres is not something that interests me, because for road use there isn't the same benefit or desire to run very low pressures.

To be honest, I find it a little frustrating that tyre insert companies don't provide rolling resistance data.  Often they don't even address the rolling resistance question at all.  This is perhaps understandable if downhill mountain biking is the target market, but for gravel and cyclocross applications, like this this one or this one, then I'd like to see rolling resistance data provided by the tyre insert companies.

I'm also really hoping that Bicycle Rolling Resistance will do some tyre insert testing for MTB and gravel inserts soon.  It's on their voting list, but far from the top of the list at the moment.  Tyre inserts aren't cheap, so I can't justify buying a variety of brands and testing them myself.


My tyre and foam tyre insert set-up

I previously used 35mm Schwalbe X-One tyres for my outdoor rolling resistance testing.  However, in 2020 I swapped to 
43mm Panaracer Gravel King SK TLC tyres after I damaged one of those Schwalbe tyres in the double-flat incident. Panaracer Gravel King SKs get good reviews and are a more  summer-focussed tyre, which suits my riding.  Also, they test quite well in terms of rolling resistance, based on measurements made by BicyclingRollingResistance.com.

The foam tyre inserts I bought were from Planet X, called "Barbieri Anaconda Puncture Protection System".  These are 
no longer available to buy from Planet X, but they are budget round-section 'pool noodle' type closed cell foam inserts.  They cost £19.99 including valves.

At the time of installing them, I was conscious that the rolling resistance might suffer, so I trimmed the top of the round section off, as shown in the photo to the left.  The aim was to provide more of a gap between the outside of the foam insert and the inside of the tyre, trying to prevent the tyre from touching the foam insert at the contact patch.  Through some tyre drop measurements, I worked out that the inside of the tyre would touch the insert only at pressures below 14-16 psi on a flat surface, which corresponds to a tyre drop of around 15mm.  However, it should be noted that the same 14-16 psi tyre pressure should result in a larger tyre drop when it's on the rollers though, because their small roller diameter exerts a higher localised load on the tyre at the contact patch.

The photo below shows some quick (rather crude) measurements of the tyre external depth and also the depth of the foam tyre insert.


The width of the tyre and the foam insert are shown below. The foam insert is fairly narrow, at 30.4mm, considering the rim has an internal width of 23mm and an external width of 28mm.  Nevertheless, when riding over rocks and other obstacles, I felt qualitatively that the foam inserts were being compressed whenever I hit obstacle that would have otherwise caused the tyre to bottom-out.  It didn't feel like the usual tyre-on-rim contact that you get without tyre inserts installed.  


Test method selection

My test method was the same roller testing, as I described in my previous blog post.  Why roller testing though?  Virtual elevation (VE) testing would have been suitable too, based on my previous experiences, but VE testing is significantly less convenient:
  • VE testing takes much longer to perform, several hours as opposed to about one hour for roller testing.
  • VE testing needs good conditions: Low wind days are needed, and obviously also daylight, which is more difficult in winter.
  • For VE testing outdoors, the ground needs to be fairly robust, so that multiple runs don't degrade the ground and lead to a drift in the rolling resistance being measured. This generally means that for off-road applications, the ground needs to be dry.  Again, that's difficult or impossible in winter (in the UK).
In its favour, VE testing does however provide the complete picture of all three rolling resistance losses: (1) Tyre hysteretic losses; (2) suspension/impedance losses; (3) ground deformation hysteretic losses.  Roller testing on the other hand will only provide an indication of #1, the tyre hysteretic losses.  However, for foam tyre inserts, I felt that this was the primary mechanism by which inserts might cause additional losses. Therefore, I decide that roller testing was the best method for this situation.


Test method description

I started with the foam insert installed in the tyre, performed the tests with various pressures, removed the foam insert, then repeated the tests with various pressures again without the insert in place.

The rear wheel weighing was done using my front fork mount, by lifting the bike off to the side of the rollers and onto the bathroom scales.  As before, timber blocks were use to ensure the bike was horizontal while on the scales, thus ensuring the scales weighed the same rear wheel weight as the weight that's on the rear wheel for the rollers.
For the roller testing, I performed a few repeats throughout the test, three specifically, which helped give me a feel for the repeatability of the results from this testing. The repeat runs are included in the results shown below. 


Results

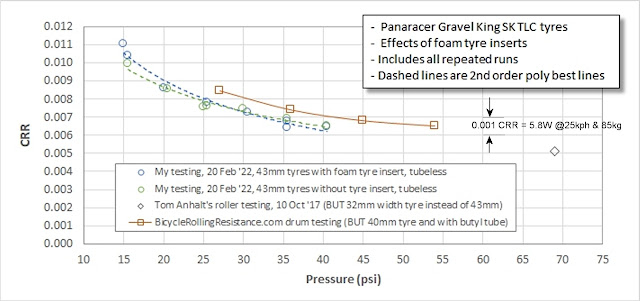
The test results are shown in the plot below, with the green and blue symbols.  The dashed lines are best fit lines put through the data.  Data from Bicycle Rolling Resistance and from Tom Anhalt's testing is also shown in the plots, although it should be noted that for those tests there are differences in the inner tube being used and also the tyre width.  

Bike tyre rolling resistance coefficient (CRR) testing using rollers and effect of foam tyre liners on rolling resistance


The raw data is shown in the spreadsheet screenshot further below:


The plot above shows that the effect of the foam tyre insert is small and possibly nothing at all.  If there is an effect of the foam insert on rolling resistance, it's close to the precision and the repeatability of what can be tested I think, so less than about 2-3 Watts at 25 kph.

I was expecting a larger difference at low pressure, where the foam insert might have been getting compressed.  However, even at 15 psi, the differences are small.  The best fit lines suggest there is a larger difference at 15 psi, but the green and blue data points aren't a lot further apart at 15psi than they are than elsewhere.  Additional testing to collect more points (repeats) would be needed if I wanted to really confirm that.


Conclusion and caveats

In any case, the conclusion is that the effect of these foam tyre inserts is small at the most, and possibly nothing.

There is one final caveat to mention though: When I removed the foam insert I noticed that the tape holding the two ends of the foam insert had come apart and so the two ends of the foam insert weren't attached to each other.  I don't know when this happened, but it means that the foam insert was probably 'free floating' inside the tyre cavity, rather than being a continuous foam hoop held in contact with the rim and tyre bead.  In a way, it would have been behaving rather like a Huck Norris foam insert, but possibly with even less contact with the tyre, owing to it's small diameter.  I don't know if this has an effect, but it's important to note.  I didn't have the time or inclination to repair the foam insert (to clean and re-join the ends), re-test all the pressures, and then remove the tyre again to check it was still okay.  A free-floating foam insert might possibly cause lower rolling resistance losses, because it is not contacting the tyre side wall near the rim.  However, at this point I can only speculate. 


Saturday, 19 February 2022

Testing of tyre rolling resistance using rollers - Part 2, Setup improvements

Following on from Part 1 of the roller testing described in the previous post, I made a couple of important improvements:

Speed Sensor: In my Part 1 blog post, I explained that I didn't yet have the magnetic Garmin speed sensor that I'd ordered.  I subsequently received the speed sensor through the post and installed it in a similar way to how Tom Anhalt did, setting the 'wheel circumference' on my Garmin head unit to 261mm, which is the measured roller diameter of 83.0mm, multiplied by pi.

I'm still a bit surprised the speed sensor works with the magnet triggering the sensor so quickly, at about 40-50 Hz (every 2-3 hundredths of a second!).   

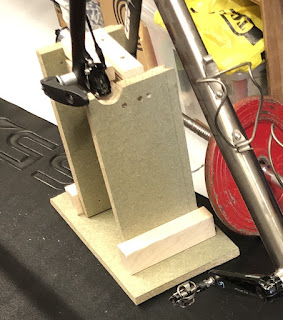
Front fork mount: Previously I had to prop myself upright using my elbow.  I built a fork mount using a spare piece of chipboard flooring and a few spare bits of timber.

The axle itself is the axle clamp borrowed off my Thule 561 bike carrier (the 561 is now discontinued). 

After making these two improvements, I wanted to check the effect on the rolling resistance measurements by re-doing the runs at 80 psi, using my road bike and Continental GP5000 tyre, as tested in Part 1.  The results below (shown with blue triangle symbols) show that these two set-up improvements have quite a small effect on the results.  It's quite reassuring that one week later, with some tweaks to the setup, I get very similar results to the previous weekend.


Sunday, 13 February 2022

Testing of tyre rolling resistance using rollers - Part 1


Bicycle tyre rolling resistance coefficient (CRR) testing using rollers
A previous blog post from 2020 described my measurements of tyre rolling resistance that I did using the Virtual Elevation outdoor method.

Tyre rolling resistance coefficients can also be measured using rollers instead, and I've been keen to try that method ever since reading about it a few years ago. However, I've never owed a pair of rollers, so that test method hasn't been possible up until now.

Recently though, there have been a couple of things I really wanted to test, which I'll describe in a future blog post.  That finally gave me the impetus to buy a pair of rollers.  I bought a pair JetBlack R1 rollers in the Evans Cycles sale for £100.


Overview of available rolling resistance testing methods

As a brief introduction, I want to first quickly describe the four methods for measuring bicycle tyre rolling resistance that I'm aware of:

1) Drum testing: This involves turning a tyre and wheel on a large drum and measuring the power required to turn the drum, to overcome the losses due to tyre rolling resistance.  An example of this kind of testing can be found on bicyclerollingresistance.com.

2) Roller testing: This is similar in principle to drum testing, but is more accessible to amateurs that don't have access to specialised equipment necessary for drum testing.  All that's needed is a standard set of rollers, a power meter, and a few small pieces of equipment (which will be described later).  An example of roller testing, which is also the exact method I used, can be found here.

3) Virtual Elevation testing: This is another technique accessible to amateurs, as long your bike has a power meter.  It is more time consuming than roller testing, but has other advantages.  My previous post here describes how I measured the rolling resistance coefficients for my cyclocross tyres on a grass surface, using this method.

4) Roll down testing: This is another technique accessible to amateurs and is also relatively quick to perform.  Unlike methods 2 and 3, it does not need a power meter.  This roll down method can therefore be very appealing to people, especially as it gives a direct speed/time benefit, needing no data processing.  However, many experts express reservations about the sensitivity of roll down testing to detect changes in rolling resistance.  For example, the runs are generally performed on the same hill in one direction and therefore the results are affected by small, indiscernible fluctuations in wind.  VE testing (method 3) mitigates this sensitivity to the wind, partly at least, by performing laps that go against and also with the wind.


Roller testing method description

One of the pioneers and experts in tyre rolling resistance testing is Tom Anhalt.  For simplicity, I followed Tom's roller method as closely as possible, as described in his blog here.  Since the description on Tom's webpage is already very clear, I won't repeat it here.  Instead, I'll only describe where I deviated from his method, or one or two other interesting points:
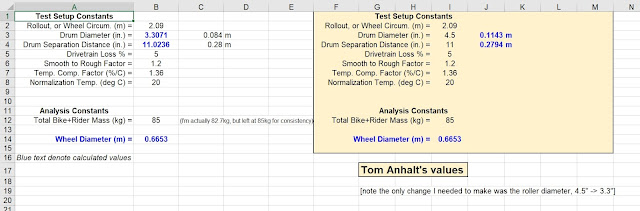
  • I used Tom's gravel tyre data recording and processing spreadsheet pretty much as-is.  I saw little value in re-working the spreadsheet, or creating my own version.  If I did so, I would only risk making mistakes.  Only one change was needed, and that was the diameter of the rollers:  Mine were 83mm in diameter whereas Tom's were larger, 114mm in diameter.
  • I didn't have an old-fashioned Garmin magnetic speed sensor when I did this initial testing.  I had already ordered one from a seller on eBay, but I was still waiting for it to be delivered.  Instead I had to use my (newer) Garmin wheel hub based speed sensor, which I think works using an accelerometer to detect rotation frequency, in combination with a prescribed wheel circumference.  This is a simplification, because keeping the wheel circumference fixed isn't quite right when the tyre pressure is changing.  For this initial 'shakedown' testing, though, I think this simplification is fine.
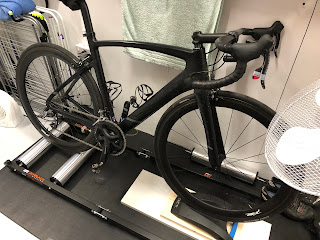
  • I didn't have a front fork mount.  I later constructed one (to be described in a future Part 2 blog post), but for this initial test I had to improvise.  Instead, I positioned the rollers next to a shelf (see photo below) and used my elbow to keep myself upright.  This really wasn't as bad as it sounds!  It's far from ideal though.
  • For this testing, and for everything else, I used a Stages left-hand crank based power meter.  Using a single-sided power meter is inferior to using a dual-sided power meter, but it's all I have unfortunately.  At some point, I will invest in a dual-sided power meter.

Measuring weight on the rear bike wheel
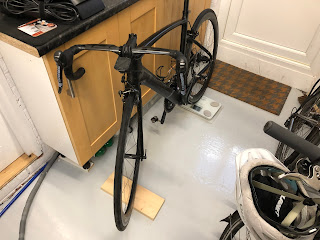
Rear wheel weighing.  I asked my wife to read off the number on the bathroom scales while I sat on the bike.

The wooden block under the front wheel was there to ensure the bike was level, which I checked using a 6ft spirit level spanning the front and rear quick release skewers.  A similar level check was done for bike on the rollers, for the actual roller testing.


Bike tyre rolling resistance coefficient (CRR) testing using rollers
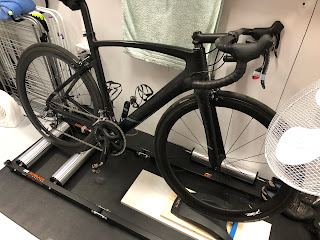
The photo on the left shows my initial roller testing setup.  The setup was improved in subsequent weeks, but this is how it was for these initial tests.


Results

In view of the simplifications explained above, I didn't want to invest too much time doing a lot of testing initially, so I spent just half an hour or so collecting and processing some data.  I followed Tom Anhalt's method exactly, so used a 5-minute warm up period, and a 4-minute 'run' period, then processing the data from the last 2 minutes of those 4 minutes to get average power and speed values.

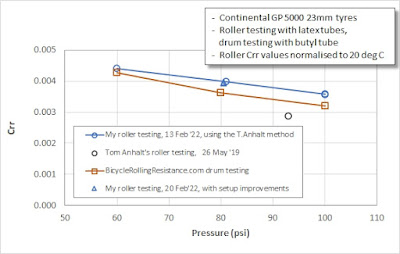
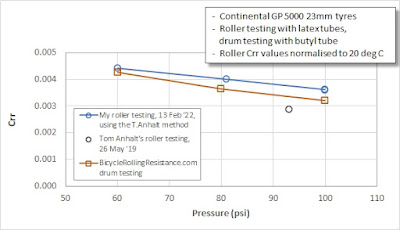
I tested my 23mm Continental GP5000 tyre at different pressures.  Results are shown below, comparing my results.  I have shown screenshots of the spreadsheet for full transparency of how I arrived at the values in the plot.

Setup and Analysis Constants

Speed, Power and CRR derivation spreadsheet


Bike tyre rolling resistance coefficient (CRR) testing using rollers

Rolling Resistance Coefficient (CRR) plot
 

The results shown in the plot above are quite encouraging I think.  Considering the small simplifications in my test (i.e. the lack of an appropriate speed sensor and lack of a front axle support), I think the results look reasonable.  The trend and values are similar to the Bicycle Rolling Resistance data (orange points), although my CRR values should actually be lower than the BRR values, instead of higher, because my testing was done with a latex inner tube whereas BRR's testing is done with standard butyl tube.

Comparisons versus Tom Anhalt's data point (the black circle in the plot) should be a reasonable like-for-like comparison, with differences coming possibly only from the roller diameter, brand of rollers, and power meter differences.  My CRR values are about 30% higher, which is quite a big difference.  I can imagine a few possible explanations, but as this was the first time I've used my rollers, I wonder if the roller bearings need 'running in', which would reduce their friction losses and would therefore reduce the apparent CRR values. This is something that should become more clear if I do further testing.

On the positive side, my repeated point at 100 psi tyre pressure for the 4th run shows excellent repeatability with the equivalent point for the 1st run.  The two data points at 100 psi are barely discernible on the plot because they are so close to each other.

For my next set of testing, I will probably use my gravel bike and try to measure the effect of foam tyre inserts on the rolling resistance coefficient.  This will be documented in a future blog post.


Sunday, 31 October 2021

Quiz: Match the tyre to it's rolling resistance numbers

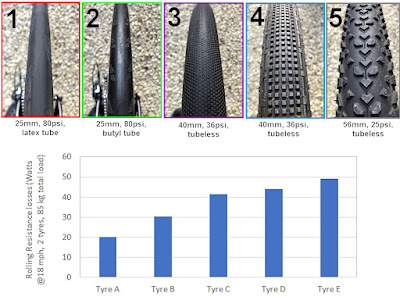
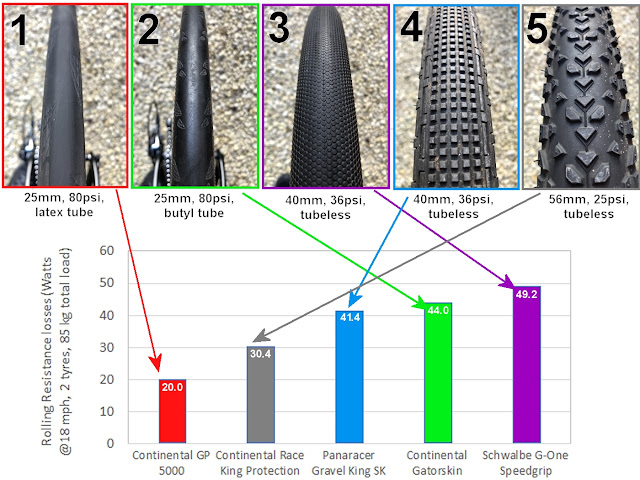
Here are five tyres and five rolling resistance power losses.  Higher rolling resistance losses mean the tyres are 'slower'.

Which rolling resistance number corresponds to which tyre?  Have a guess.

Beware though, looks can be deceiving.  The answers are at the bottom of this blog post.


When friends, especially beginner cyclists, ask me for advice about their bikes, one of my first suggestions is to get good tyres.  It's difficult to convince them though, to convey the differences between a fast tyre versus a slow tyre.  Many road tyres look outwardly identical.  There is a temptation to judge the rolling resistance of a tyre by it's tread, it's width or it's pressure.  There's much more to it than that, though.

For example, Tyres #1 and #2 look similar. They are both slicks, and their width and pressures are identical. They must perform similarly then, right?  The MTB tyre on the top right must be slow, because it's wide soft and is knobbly, right?

These pre-conceptions mean that many people make poor tyre choices, or don't realise the consequences of their tyre choice.  It doesn't have to be that way.  With a bit of time, independent tyre test data can be found on the internet - rolling resistance data like the data used and presented in this blog post - allowing anyone to make an informed and wise decision about where to spend their money and what tyres to buy.

Two good sources on independent data are:

https://www.bicyclerollingresistance.com/

http://bikeblather.blogspot.com/


Results of the quiz are shown below.

Who would have guessed a knobbly MTB tyre at 25psi has a significantly lower rolling resistance than a slick 23mm road tyre at 80 psi?  Take care though, because this is one of the fastest MTB tyres, being compared to one of the slowest road tyres.

Nevertheless, I'm sure you'll agree, looks can be deceiving...


Saturday, 23 October 2021

Road Bike vs Gravel vs MTB speed test

Road bike versus gravel bike versus mountain bike (MTB) speed comparison
How much slower is a gravel bike than a road bike, on the road? 

How much slower is a mountain bike than a gravel bike? 

These are the questions I tried to answer with a quick test I did yesterday afternoon.  The results were a little surprising... 


The Bikes

Road Bike

A road bike from Planet X.

It has 50mm deep carbon wheels. The tyres are fast road bike tyres: Continental GP5000s with latex inner tubes.

Tyres were inflated to 80 psi.

It weighs around 7kg.


Gravel Bike

A titanium cyclocross bike from Planet X.

It's fitted with fairly fast small-knobbed gravel tyres (hence I'm calling it the "gravel bike"). The tyres are 43mm Panaracer GravelKing SK TLCs, run tubeless.

Tyres were inflated to 25 psi.

It weighs around 9kg.


Mountain Bike

A Scott hardtail.

On the front, it's fitted with a 2.25" Schwalbe Rocket Ron Snakeskin Addix Speed tyre. On the back, it has a 2.2" Continental Race King Protection tyre. Both are tubeless. These are both fast XC tyres.

Tyres were inflated to 22 psi.

It weighs around 9kg.


Clothing / Kit

For all three bikes, I wore the same road bike style kit, a tight fitting jersey and lycra shorts, base layer, standard helmet.  The same two bottles were used on all of the bikes.


Test Method

I rode the same 8 mile road circuit on all three bike, back-to-back during a 2 hour window.  It was fairly flat, with only 80m of climbing over those 8 miles.  I started with the road bike, then the gravel bike, then the MTB.

I recorded the speed on 7.5 mile stretch that was fairly uninterrupted. There was one set of traffic lights, at mile 5, where I had to stop the Garmin and re-start it. My average speeds that I extracted from Strava are not affected by the length of the stoppage at the lights.  Speed and position data was from GPS.

I tried to ensure a consistent effort on all three bike.  The road and gravel bikes both have Stages power meters. My previously power meter cross-calibration work showed that my road bike power meter over-reads by about 10W relative to my gravel bike's power meter. Hence I targeted 250W for the road bike and 240W as the target for the gravel bike.

My mountain bike doesn't have a power meter, so I had to go off feel, targeting the same rate of perceived exertion as for the other two.  I did however, have a heart rate monitor, and although I wasn't monitoring my HR during the test, my HR was close between all three bikes (Road Bike:160bpm, Gravel:157bpm, MTB:156bpm).  As a result, I was fairly satisfied that my effort and power was similar on all three bikes.

The geometry and position on the bikes is obviously different.  I chose to ride all three bikes in the style and position I would normally chose for riding each of those bikes.  Therefore, for the road bike, I was most stretched out and had the lowest torso.  I was most upright for the MTB. For the gravel bike, I was in between the other two. 


Results

As mentioned in the intro, the results were a little surprising:

   Road Bike:   20.2 mph / 32.5 kph,  245W average

   Gravel Bike: 18.5 mph / 29.8 kph, 239W average (=249W with +10W correction)

   MTB:            18.6 mph / 29.9 kph


So the Gravel bike was 8.5% slower than the road bike, which is close to what I expected.  The real surprise, though, is how fast the MTB was relative to the other two, and that it was marginally faster than the gravel bike!


Analysis

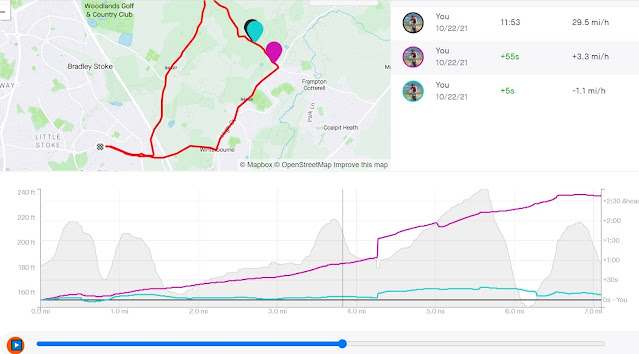
I created a segment in Strava, and used the Strava comparison feature to see how all three compared:

Gravel = Black (the reference), Road Bike = pinky purple, MTB = blue 

Road vs gravel CX vs MTB speed


Looking at this plot, it's clear that the road bike gains time on the other two everywhere.  Ignore the steps at ~4.3 miles, which is the traffic lights.  Stopping at the traffic light affects the segment times, which is based on clock time, but it doesn't affect the average speed, because I stopped my Garmin and is therefore based on time moving.

Then, the plot shows the MTB seems to gain time slightly on the uphill sections and lose time on the downhill sections.  The time losses on the faster downhill sections make sense, because the MTB and my position on the MTB is obviously less aerodynamic than the other two bikes.

It was strange, though, that it gained time on the gravel bike on the slower uphill sections. The two are similar in their weight.  Could it be the rolling resistance? Both gravel and MTB tyres were reasonably fast tyres, but the gravel bike tyres look like they should be faster.

To check this, I looked at the rolling resistance data on the Bicycle Rolling Resistance website, which is an excellent resource that I use to help me choose tyres.  I was familiar with rolling resistance data for all my sets of tyres, versus alternative choices in their categories, but I'd never compared the rolling resistance of gravel and MTB tyres against each other. To my surprise, the MTB tyres are actually lower rolling resistance that the gravel tyres:

Gravel Tyres: 56.6W @27psi,  49.4W @36psi -> 65.4W at the 25psi pressure ridden

                         -8W adjustment for tubeless setup -> 57.4W at the 25psi pressure ridden

MTB Front tyre: 48.6W @35psi, 53.4W @25psi -> 59.6W at the 22psi pressure ridden

MTB Rear tyre: 36.0W @35psi, 40.4W @25psi -> 46.1W at the 22psi pressure ridden

MTB average: 52.8W assuming 50/50 front/rear weight split (for simplicity)

                         -10W adjustment for tubeless setup -> 42.8W at the 22psi pressure ridden

All power values above are for two tyres at 85kg load at 18mph, which is quite close to my test conditions.  The GravelKing tyre data was for 38mm version, but recent testing on the BicycleRollingResistance website has shown that the performance difference between 35mm and 40mm versions of the GravelKing TLC is very similar, so using the data from the 38mm version is good enough I think.  Both rolling resistance numbers have been adjusted based for tubeless a tubeless set-up, because the standard testing uses butyl inner tubes. The MTB tyre power number was reduced by 10W, based on this BicycleRollingResistance data.  The gravel tyre power number was reduced by an estimated 8W, estimated by looking at how latex tube versus butyl tubes affected the MTB and road bike power numbers.

Something to note is that I am running foam tyre inserts in my Gravel tyres, although I took care to ensure the tyre inserts are not contacting the tyre and getting compressed at the contact patch (and with some margin to spare), to ensure the tyre inserts don't affect rolling resistance.

For reference, the road bike tyres are much lower rolling resistance than both the gravel and MTB tyres:

Road Bike tyres: 20.0W for a GP5000 with latex tubes at 80 psi, i.e. a 23-37 Watt advantage over both the MTB and gravel bike tyres.


Discussion & Conclusion

The results surprised me, but upon closer inspection it's clear that the MTB has an (unexpected) 14.6 Watt rolling resistance advantage of the gravel bike.  This seems to have an beneficial effect at the slower speeds, when the aerodynamic disadvantages of the MTB are less dominant, and overall it gave the MTB a marginally higher speed one the 7.5 mile road route.

We have to keep in mind that the MTB did not have a power meter, but nevertheless I took care not to go 'too hard' on the MTB, by riding that bike last (when I was most fatigued), and by checking my heart rate data after the ride, to ensure it was not higher than for the other two bikes. 

This leads me to now wonder: If my gravel bike isn't faster than the MTB on a flat-ish road route, in what situation would the gravel bike be better than the MTB, if any?? 


Saturday, 18 September 2021

Stiff pedal bearings/seals - What's the power loss?


Power loss from stiff pedals

The other day, one of my friends commented in our bike chat WhatsApp group about his flat pedals and how they were "quite stiff".  He was wondering how much power this would be costing him.

I told him that if he was curious enough to spend a few minutes looking into it, he could measure the resistive torque and calculate the associated power loss from that.

I did a back-of-the-envelope calculation of the power cost, based on 80 rpm cadence (see below).

The resistive torque he can feel when turns the pedals is either coming from either poor bearings, or more likely (as the pedals were new), from stiff seals.

I told him he could measure the resistive torque by hanging a weight off the pedal and measure the distance from the pedal axle.  Progressively adding weight until the pedal turned would then give a resistive torque (weight in Newtons multiplied by moment arm). Multiplying by cadence in rad/s then provided the power lost for one pedal.  Multiply by two to give total bike power loss.  Strictly speaking, what's measured with this method is stiction, or rather the resistive torque due to stiction, whereas we really want the friction losses when the pedal is turning. That's more difficult to measure simply though.  I think the stiction torque would give a conservative (slightly high) estimate of the power cost, which is good enough I think.

The results?  He found he needed 161g of weight at a 5cm moment arm to turn the pedal.  He calculated this to be 1.35 Watts of power loss using my equation below.  So not significant, but not nothing either.


Thursday, 19 August 2021

Time trial aero improvements


CdA time trial improvements
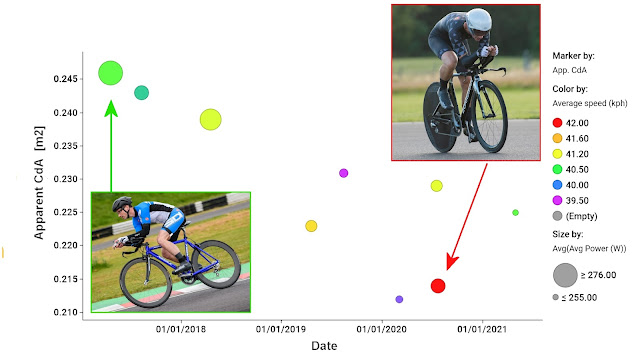
This plot shows my improvements in my 10 mile time trial performance over the last 4 years.

I have been doing time trials since about 2017, having converted my old winter road bike to a time trial bike, using a set of clip-on aero bars.

Over the last 4 years, I've made various improvements to the bike, my kit, and more importantly my position on the bike.

My time trial times have gradually improved.  Not significantly so, but considering my power hasn't really improved during that time, these speed improvements are a result of improvements to my equipment and position.

I do a combination of local club 10 mile evening time trials and also 10 mile TTs organised by DBmax at the local Castle Combe motor racing circuit.  I used the data collected from these Castle Combe time trials to analyse my improvements in performance, particularly my aerodynamic efficiency (CdA), which is a parameter that's critical for good time trial performance.

2017 Equipment

This photo shows my setup in 2017, which was my first Castle Combe 10 mile TT:

- Ribble Audax aluminium frameset.
- Superstar Components 46/66 carbon wheels
- 3T aluminium base bar
- 2nd hand clip-on hand aero bars
- Regular bib shorts and jersey
- Specialized Evade aero road helmet
- Velotoze shoe covers


Over the last few years, I made a number of improvements.  Often, when I had to make a choice about equipment or kit selection, to decide which was fastest, I did aero testing using the Chung Virtual Elevation Method to determine the CdA of various set-ups.  I haven't been exhaustive in my Chung testing, because it’s quite time consuming to do properly, for every change.  However, I've used it for a few things, for example to compare two different helmets and two different skinsuits.

The plot at the top of this post shows the improvements in my apparent CdA over time, determined using the free Golden Cheetah Aerolab software.  This type of CdA calculation assumes no wind, hence I call it 'apparent CdA'.  Furthermore, for all data points, I have assumed similar values for weight and rolling resistance.  Consequently, any improvements in either of those two things will appear as benefits in the apparent CdA value. My weight and the rolling resistance of my tyres has been reasonably consistent though, so this is an acceptable simplification I think.

The largest improvements in CdA seem to have come from lowering my aerobars, allowing me to get my back flatter and my head lower.  I haven't specifically tested bar height via Chung testing, but the biggest improvements in CdA seem to correlate with bar height.  Interestingly, the bar height adjustment was the cheapest upgrade of all, costing me just £15 for an adjustable stem from Decathlon.  All other kit upgrades, costing probably £1000-£1500, didn't seem to be as effective at reducing my CdA.  So the best modification was also the cheapest one.

Subjectively, my position now looks much better on the bike.  In addition to my position changes, I've also improved the bike and kit: 

2020/2021 Equipment

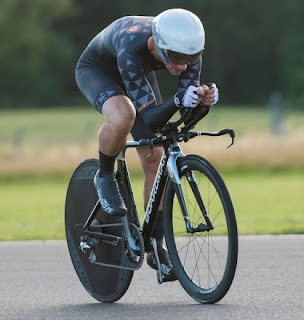
- Boardman Air TT carbon frameset.
- Wiggle Prime Black 50mm front wheel.
- Planet X disc rear wheel
- Single 50t front chainring
- Bell Javelin 2nd hand helmet
- Bioracer/Nopinz Speed Concept skinsuit


A few things were unchanged from my 2017 setup:
- 3T aluminium base bar
- 2nd hand clip-on hand aero bars
- Velotoze shoe covers


Speed Improvements

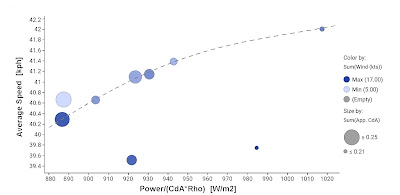
The plot below shows the improvements in my CdA over time, as a result of the bike and positions improvements I've made.  The colour of the points indicates the average speed for each 10 mile TT.  The size of the circular points indicates that average power I managed to achieve.


As can be sWhat's clear from the plot above is that the fastest times were not achieved with the highest power (largest circles), but actually the speed is a function of both power and CdA.  In fact, it's clear from the speeds that a reduction in power, often a result of being lower at the front, is more than compensated by an improvement in CdA, resulting in net benefit for the average speed.

For time trials, it's often said that you want to maximise Power divided by CdA.  All things being equal, a time trial average speed will be dependent on this parameter, Power/CdA.  For example, if CdA can be reduced by 10%, then the power required to maintain the same speed also drops by 10%, simple as that.

I wanted to see how my time trial average speeds correlated with Power/CdA.  However, since I was comparing time trial performances on different days, I also wanted to account for changes in air density from day to day, since air density directly affects aerodynamic drag and therefore speed.  Lowering the air density by 10% has the same effect as reducing the CdA by 10%.  The air density effect can be incorporated by considering Power/[CdA*Rho] as the parameter to plot speed against, instead of Power/[CdA].


The plot below shows how my average time trial speeds correlate against Power/[CdA*Rho].


In the plot above that you can see that my average speed generally correlates well with Power/[CdA*Rho].  There are, however, two annoying outliers where my speed was very low considering my average power, the air density and my apparent CdA.  I don't yet understand what has caused these two outliers.  I've checked my Golden Cheetah virtual elevation calculation (the CdA calculation) and those seem fine.  It might be something as simple as a badly calibrated speed sensor or a power meter that hasn't been zero'd.


Sunday, 7 February 2021

Real life speeds versus virtual cycling speeds


Comparison of RGT Cycling virtual speeds versus real life cycling speeds
I like the RGT Cycling virtual cycling app.  Unlike Zwift, it has a neat feature that allows you to create 'magic roads', which are virtual roads created from real road GPX data.  Anybody can upload GPX data to create a magic road.

This allows you to ride real roads inside RGT Cycling, so either local roads that you've ridden already, or famous roads that you'd like to ride (created by other people).

In this time of COVID-19 restrictions, it means that virtual races can be organised on real racing circuits, which is pretty cool.  Somebody else has already uploaded my local Odd Down Cycle Racing Circuit to the magicroads.org website.  Virtual races are being organised by PDQ Cycle Coaching, the guys that organised the real life races I did back in 2019.


Odd Down Cycle Circuit
The Odd Down Cycle Circuit is located near Bath, in the South West of England.  It's a 1-mile circuit, with very mild elevation changes and a couple of hairpins that can be taken at speeds below about 20-25 mph.

RGT Cycling also prides itself on providing a realistic virtual cycling simulation, which is something I like.  They strive to get the modelling accurate and the app includes features like braking and speed limits around tight corners, which is something that's different to Zwift, for example.

I thought it would be interesting to compare my real life cycling speeds around the Odd Down Circuit with the virtual speeds achieved in RGT Cycling.


Real life speeds

PDQ Cycle Coaching Odd Down 4th Cat Race 2019
I extracted speeds from three races I did in Spring/Summer of 2019.  I only extracted speed from the warm up laps, not the races themselves, so that the speed would not be subject to drafting.  The average power during these warm ups varied from about 150W to 260W.  I usually do a ramp-type warm up, with the power held constant for 2-3 minutes at a time before increasing it. Therefore, most of the warm-up laps were done at roughly constant power.

The data from three separate warm ups (three different days) allowed some checking of the influence of external weather conditions, which would affect average speeds.  Lap speeds were obtained from Strava for the one-lap segment that has been created in Strava.  Results are shown below with blue symbols.

Comparison of RGT Cycling virtual speeds versus real life cycling speeds

I also wanted to check my CdA because any speed discrepancies with RGT could be due to different CdA assumptions by RGT.  I estimated my CdA by loading my warm up GPX data into Golden Cheetah and using the Aerolab Chung method virtual elevation plots to determine CdA.  My CdA could be estimated for two of the three warm ups, and was 0.360 and 0.375 m^2 for those two warm ups.  I had to make some assumptions/guesses about the rolling resistance coefficient (CRR=0.004), the drivetrain efficiency (97%), my total weight (80kg) and the air density (1.2 kg/m3).  It's worth noting that my warm up laps were done on the hoods, with fairly straight arms, whereas my RGT avatar drops into a more aerodynamic horizontal forearm position when speeds are above about 25 kph (15 mph), which is most of the lap. 


RGT Virtual Speeds

RGT Cycling Odd Down
I rode the Odd Down Circuit in RGT Cycling on Saturday 6th Feb 2021, selecting no bots, so that my riding would be solo, with no drafting.  The speeds were measured in the same way, using a Strava segment, and are shown with the red symbols on the plot above.  The RGT ride was also loaded into Golden Cheetah, making similar assumptions about CRR=0.004, drivetrain efficiency (97%), weight (80 kg) and air density (1.2 kg/m3).  This gave a CdA value of 0.285, which is quite a lot smaller that my real life CdA of 0.360-0.375.  Incidentally, I saw a tweet from Robert Chung a while ago, saying that he had found that Zwift also assumes a rather optimistic CdA of 0.28.


Differences and possible reasons

The general agreement in the plot above seems to be not too bad on the face of it, but it's not great either.  The RGT speeds are approximately 1-2 mph higher, and this I think comes primarily from the lower CdA assumed by RGT.  The difference of CdA, 0.285 in RGT versus 0.370 in real life, is quite significant.  That difference would result in a speed difference of 1mph at 250W, or about 30W at a fixed speed.

Of course, RGT is not trying to simulate me personally, and it has no idea how aerodynamic my bike and body combination is, or was during those warm ups.  It's worth bearing in mind that my warm up laps were done on the hoods with fairly straight arms, so that position will be less aerodynamic than what RGT is assuming.  I also wasn't wearing a skinsuit, and hadn't shaved my legs, both of which the RGT avatar has.  These are differences that Specialized have shown in their videos have a significant effect on aerodynamic efficiency.

It's also worth noting that I used the same power meter for all rides, including indoor RGT ride, so there should not be a bias coming from using different power meters.  It is possible that my left crank only power meter is slightly over-estimating my power, and there is some evidence of this based on recent testing.  An over-estimated power would result in RGT speeds that are higher than real life, and could also partially account for the different apparent CdA values. 

Overall though, I think the differences are primarily coming from the different riding position that RGT is assuming (horizontal forearms), relative to the position I adopted during my real life warm ups (almost straight arms, more upright torso).  Wind tunnel test performed by Aerocoach in 2019 showed that dropping the elbows into a horizontal forearm position ('breakaway hoods') significantly reduced Xavier Disley's CdA from 0.3506 m^2 to 0.2718 m^2.  This reduction of around 0.08 m^2 is very similar to the CdA differences extracted from my RGT ride and my real life rides, for similar changes in position.  Therefore, I conclude that the RGT cycling simulation is accurate, once you factor in the cycling positions that are assumed and adopted by the RGT avatar.

Besides this quantitative comparison of speeds, there is a qualitative element too, particularly around the cornering.  I found the RGT simulation of corners to be fairly realistic.  In real races, I usually have to brake for the hairpins due to the concertina effects when riding in the bunch.  During warm ups or solo breakaways, though, I often don't need to brake.  I remember holding about 280W during one solo breakaway and not needing to brake, although that was very close to the limit.  In RGT, the same thing happened, with just a momentary 1-2 seconds of braking before the bottom hairpin during the laps at 270W.  Qualitatively, this seemed to agree with real life, although it's difficult to be too conclusive.


Conclusion

All in all, I'd say that the RGT simulation is a realistic simulation of real life riding around my local Odd Down Cycle Circuit.  Where differences exist, I think there are some plausible explanations for what might be causing those discrepancies.