A previous blog post from 2020 described my measurements of tyre rolling resistance that I did using the Virtual Elevation outdoor method.
Tyre rolling resistance coefficients can also be measured using rollers instead, and I've been keen to try that method ever since reading about it a few years ago. However, I've never owed a pair of rollers, so that test method hasn't been possible up until now.
Recently though, there have been a couple of things I really wanted to test, which I'll describe in a future blog post. That finally gave me the impetus to buy a pair of rollers. I bought a pair JetBlack R1 rollers in the Evans Cycles sale for £100.
Overview of available rolling resistance testing methods
As a brief introduction, I want to first quickly describe the four methods for measuring bicycle tyre rolling resistance that I'm aware of:
1) Drum testing: This involves turning a tyre and wheel on a large drum and measuring the power required to turn the drum, to overcome the losses due to tyre rolling resistance. An example of this kind of testing can be found on bicyclerollingresistance.com.
2) Roller testing: This is similar in principle to drum testing, but is more accessible to amateurs that don't have access to specialised equipment necessary for drum testing. All that's needed is a standard set of rollers, a power meter, and a few small pieces of equipment (which will be described later). An example of roller testing, which is also the exact method I used, can be found here.
3) Virtual Elevation testing: This is another technique accessible to amateurs, as long your bike has a power meter. It is more time consuming than roller testing, but has other advantages. My previous post here describes how I measured the rolling resistance coefficients for my cyclocross tyres on a grass surface, using this method.
4) Roll down testing: This is another technique accessible to amateurs and is also relatively quick to perform. Unlike methods 2 and 3, it does not need a power meter. This roll down method can therefore be very appealing to people, especially as it gives a direct speed/time benefit, needing no data processing. However, many experts express reservations about the sensitivity of roll down testing to detect changes in rolling resistance. For example, the runs are generally performed on the same hill in one direction and therefore the results are affected by small, indiscernible fluctuations in wind. VE testing (method 3) mitigates this sensitivity to the wind, partly at least, by performing laps that go against and also with the wind.
Roller testing method description
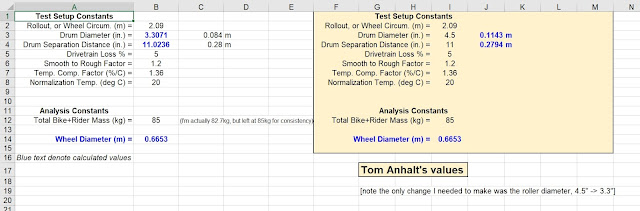
One of the pioneers and experts in tyre rolling resistance testing is Tom Anhalt. For simplicity, I followed Tom's roller method as closely as possible, as described in his blog here. Since the description on Tom's webpage is already very clear, I won't repeat it here. Instead, I'll only describe where I deviated from his method, or one or two other interesting points: - I used Tom's gravel tyre data recording and processing spreadsheet pretty much as-is. I saw little value in re-working the spreadsheet, or creating my own version. If I did so, I would only risk making mistakes. Only one change was needed, and that was the diameter of the rollers: Mine were 83mm in diameter whereas Tom's were larger, 114mm in diameter.
I didn't have an old-fashioned Garmin magnetic speed sensor when I did this initial testing. I had already ordered one from a seller on eBay, but I was still waiting for it to be delivered. Instead I had to use my (newer) Garmin wheel hub based speed sensor, which I think works using an accelerometer to detect rotation frequency, in combination with a prescribed wheel circumference. This is a simplification, because keeping the wheel circumference fixed isn't quite right when the tyre pressure is changing. For this initial 'shakedown' testing, though, I think this simplification is fine.
I didn't have a front fork mount. I later constructed one (to be described in a future Part 2 blog post), but for this initial test I had to improvise. Instead, I positioned the rollers next to a shelf (see photo below) and used my elbow to keep myself upright. This really wasn't as bad as it sounds! It's far from ideal though.
For this testing, and for everything else, I used a Stages left-hand crank based power meter. Using a single-sided power meter is inferior to using a dual-sided power meter, but it's all I have unfortunately. At some point, I will invest in a dual-sided power meter.
Rear wheel weighing. I asked my wife to read off the number on the bathroom scales while I sat on the bike.
The wooden block under the front wheel was there to ensure the bike was level, which I checked using a 6ft spirit level spanning the front and rear quick release skewers. A similar level check was done for bike on the rollers, for the actual roller testing.
The photo on the left shows my initial roller testing setup. The setup was improved in subsequent weeks, but this is how it was for these initial tests.
Results
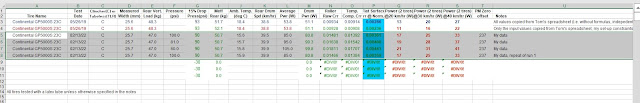
In view of the simplifications explained above, I didn't want to invest too much time doing a lot of testing initially, so I spent just half an hour or so collecting and processing some data. I followed Tom Anhalt's method exactly, so used a 5-minute warm up period, and a 4-minute 'run' period, then processing the data from the last 2 minutes of those 4 minutes to get average power and speed values.
I tested my 23mm Continental GP5000 tyre at different pressures. Results are shown below, comparing my results. I have shown screenshots of the spreadsheet for full transparency of how I arrived at the values in the plot.
Setup and Analysis Constants
Speed, Power and CRR derivation spreadsheet
Rolling Resistance Coefficient (CRR) plot
The results shown in the plot above are quite encouraging I think. Considering the small simplifications in my test (i.e. the lack of an appropriate speed sensor and lack of a front axle support), I think the results look reasonable. The trend and values are similar to the Bicycle Rolling Resistance data (orange points), although my CRR values should actually be lower than the BRR values, instead of higher, because my testing was done with a latex inner tube whereas BRR's testing is done with standard butyl tube.
Comparisons versus Tom Anhalt's data point (the black circle in the plot) should be a reasonable like-for-like comparison, with differences coming possibly only from the roller diameter, brand of rollers, and power meter differences. My CRR values are about 30% higher, which is quite a big difference. I can imagine a few possible explanations, but as this was the first time I've used my rollers, I wonder if the roller bearings need 'running in', which would reduce their friction losses and would therefore reduce the apparent CRR values. This is something that should become more clear if I do further testing.
On the positive side, my repeated point at 100 psi tyre pressure for the 4th run shows excellent repeatability with the equivalent point for the 1st run. The two data points at 100 psi are barely discernible on the plot because they are so close to each other.
For my next set of testing, I will probably use my gravel bike and try to measure the effect of foam tyre inserts on the rolling resistance coefficient. This will be documented in a future blog post.


 testing using rollers")
 testing using rollers")


0 comments:
Post a Comment