Showing posts with label Rolling resistance testing. Show all posts

Saturday, 28 September 2024

Back-to-back rolling resistance testing: MTB versus Cyclocross tyres

Last year, in October 2023, I published the results from some tyre rolling resistance tests (see blog post here) in which I tested my cyclocross bike with 33mm cyclocross tyres.

Those tests showed that my cyclocross (CX) tyres were much slower than my Schwalbe Thunder Burt mountain bike (MTB) tyres. The CX tyres had a CRR value nearly double the CRR of the MTB tyres, which was a huge difference.

However, the two tyres were tested on different days, with different bikes and different power meters, so there were a number of factors that cast doubt upon that comparison.  Since doing that test, and especially as the results were so surprising, I've wanted to repeat the test by testing both tyres on the same day, with same power meter, thereby improving the quality of the test.  This blog post describes my latest test results, and thereby allows me to conclude, with much more certainty, which of my two bikes is faster for dry cyclocross races.


Recap of previous test results

The previous results are shown in the plot to the left.

The data points shown in red are the CRR values obtained from my hardtail mountain bike tested in June 2022.  The CRR values reach impressively low values (~0.015), much lower than the two sets of cyclocross tyres plotted in blue and green.

As noted in the plot, the Challenge Grifo/Baby Limus tyre test was done a day when the ground was softer.  This will have certainly caused the CRR values to be higher, although it's not clear how much the softer ground accounted for the differences.  Note also that the softness of the ground was only determined qualitatively by me, with no measurements etc of the firmness.


New test setup

The new test is better in several ways:

  • Three different sets of tyres, all tested back-to-back on the same day.
  • Same power meter for all tests: Favero Assioma Pro MX-2 power meter pedals.
  • The power meter pedals are a dual-sided power meter, rather than single sided power meter that I've used in the past for most of the previous testing.
The use of a dual-sided power meter ensures total power is measured, whereas single-sided power meters measure only one side (one leg) and then assume the other leg is producing the same power in order to infer total power. Dual-sided power meters are therefore superior, especially since I have discovered that my left leg/right leg balance is not 50/50 (it's more like 53% left, 47% right).  Also, and more importantly, I've also discovered that my left/right leg imbalance is not fixed, and it varies with power, so there is inconsistency and inaccuracy whenever I use my single-sided powered meter. 

Test order:

  1. Drop Bar MTB with 2.35" (60 mm) Schwalbe Thunder Burt Super Race tyres @16 psi
  2. Cyclocross bike with 33 mm Challenge Baby Limus HTLR tyres @20 psi
  3. Drop Bar MTB with 2.35" (60 mm) Schwalbe Rocket Ron Super Race tyres @16 psi

The test was performed in my usual way (see Chung method description here), with the exception that I tested only one pressure per tyre/bike this time, using pressures that I know from previous testing give good rolling resistance results but without negative drawbacks like pinch flat risks.

Speeds were measured using a hub-based speed sensor, with the diameter in my Garmin head unit set to a fixed value of 2115 mm.  Measured speeds were then scaled in the analysis based on measured diameters to give the correct speeds:

  - Schwalbe Thunder Burt:  Speed scaling factor = 2228 / 2115
  - Challenge Baby Limus:  Speed scaling factor = 2110 / 2115
  - Schwalbe Rocket Ron:  Speed scaling factor = 2245 / 2115


Results

I performed the Chung method (virtual elevation) analysis using a fixed CdA or 0.40 m^2.  It's obviously wrong to use the same value for both bikes, because it's likely that the CX bike with a lower frontal area (narrower tyres, etc) will have a slightly lower CdA.  However, in the same way that I've done it previously (see here), by using this fixed value of CdA, any performance differences between the three setups, whether those performance differences comes from aero, rolling resistance or something else, will be attributed to CRR.  Hence, whichever setup has the lowest CRR using this style of analysis will be the fastest bike.

Results with Fixed CRR


Using a fixed CRR value of 0.0261, the virtual elevation plots show that the three setups are reasonably similar.

Note that the variations in the measured elevation (the green line), should be ignored because this is simply a drift caused by changes to ambient pressure during the test (note that a one metre elevation difference measured by the Garmin barometer is equivalent to just a 0.12 millibar change in ambient pressure).  The tests were done riding laps of a grass field, so the actual elevation always returned to the same value, in reality.

The variation in the orange virtual elevation profiles show which setup is fastest.  The CX bike with 33 mm Baby Limus tyres is fractionally slower than the drop bar MTB with Thunder Burts, because it's VE profile rises slightly.  The fastest setup is actually the third one tested, the MTB with Rocket Rons, since the VE profile falls slightly for that third test.

Results with adjusted CRR values

The CRR values can be adjusted to 'flatten' the VE profiles, as shown below.


This plot shows that the three setups have the following CRR values:

  • Drop Bar MTB with 2.35" (60 mm) Schwalbe Thunder Burt tyres:  CRR = 0.0261
  • Cyclocross bike with 33 mm Challenge Baby Limus HTLR tyres:  CRR = 0.0263
  • Drop Bar MTB with 2.35" (60 mm) Schwalbe Rocket Ron tyres:    CRR = 0.0251

Note that difference between the Rocket Ron CRR of 0.0251 and the Baby Limus CRR of 0.0263 is equivalent to 6.7 Watts of rolling resistance for a 85 kg bike+rider travelling at 15 mph.  These differences aren't significant, but they aren't particularly large differences either.

It's also interesting to note the average speeds, although it's more difficult to conclude which setup is faster form these speed, because the average power are not exactly the same.

  • Drop Bar MTB + Schwalbe Thunder Burt tyres:  Avg speed = 13.79 mph @203W avg
  • Cyclocross bike + Challenge Baby Limus tyres:  Avg speed = 13.33 mph @193W avg
  • Drop Bar MTB + Schwalbe Rocket Ron tyres:    Avg speed = 13.60 mph @195W avg

Incidentally, one of the benefits of the virtual elevation method is that it's not necessary, as a tester, to hold a fixed power.  That's a really inconvenient constraint that many testers put upon themselves if they don't use a virtual elevation method and try to hold a fixed power.

Finally, it's interesting to note that the final two laps for the Rocket Ron have a significantly rising profile, even though the first four laps were flat.  Those last two laps would have a measured CRR of 0.0271, which is strange.  I have no explanation for these weird results during the last couple of laps.


Conclusions

I set out to see repeat my previous tests but with a better standard of testing, to see whether my previous conclusion that MTB tyres are faster for cyclocross still holds true.

The conclusions from this test aren't quite so clear.  The MTB tyres are still slightly faster, but not significantly so this time.  The MTB tyres are only about 1-7 Watts faster.  Therefore, I'll likely use my cyclocross bike if there is any chance of mud, since my CX bike has much better mud clearance and is less likely to get jammed up from sticky mud.

Perhaps the most surprising result of this test is that the Rocket Ron tyres were actually faster than the Thunder Burt tyres, despite being how knobbly they are compared with the Burts, and considering the tyres are similar in every other respect.  This goes against what I'd expect and is contrary to Bicycle Rolling Resistance tests (although the Rocket Ron performs quite well on BRR).  This is a test result that would be worth trying to reproduce at some point.


Sunday, 21 January 2024

Testing Schwalbe's Super Ground versus Super Race tyre versions

Last month I posted the results of the tyre rolling resistance testing I did, in which I compared the Schwalbe's Thunder Burt Super Race against the Continental Race King Protection.

Both are fast tyres, but the Super Race version of the Thunder Burt has never been tested by BRR (BicycleRollingResistance.com). Only the more robust Super Ground version of the Thunder Burt has been tested (see here).  Nevertheless, that Super Ground version of the Schwalbe Thunder Burt is so far the fasted MTB tyre tested by BRR, marginally faster than the Continental Race King Protection. 

In principle, the thinner carcass of the Super Race version of the Thunder Burt should be faster than the Super Ground version.  This is at least what Schwalbe claims.  However, some tests on BRR in the past gave some unexpected results, with the Super Ground version of the Racing Ralph testing a few Watts faster than the Super Race version.  This showed that it's not guaranteed that the Super Race version should be faster tyre, which is what motivated me to do this test.


Test details

For this test I was fortunate to have two new 2.35" Schwalbe tyres, that were brand new and unused until this test.  I had bought both the Super Ground and Super Race tyres in late 2023, so there was minimal uncertainty coming from the effect of any tyre ageing.

I tested the tyres using the same protocol used previously, which I explained in a previous post here.  As for my most recent test though, I used my MTB with its Power2Max spider-mounted power meter which measures total power.  As a consequence, this was one of the best executed and best controlled tests I've done.

I tested the two tyres in an A-B-A-B manner, so both tyres had a repeated test.  In addition, I also test my older 2022 Schwalbe Thunder Burt Super Race tyre first, to check that it gave similar results to last week.


Results

The results are shown again below.  The results are fairly conclusive, showing the Super Race version of the tyre (plotted with purple symbols/lines) being faster than the Super Ground version (plotted in red).


Thursday, 28 December 2023

Repeating the Thunder Burt vs Race King CRR test

Race King versus Thunder Burt
Yesterday (27th Dec '23) I repeated the rolling resistance test that I did last year, in which I compared two of the fastest mountain bike tyres that are available: The Schwalbe Thunder Burt Super Race tyre and the Continental Race King Protection.

Why repeat?

A couple of things have changed since I did that previous test in February 2022, which I think will improve the quality of my testing.


Firstly, last year I bought a Power2max spider-based power meter for my MTB.  A spider-based power meter has the benefit over my single-sided Stages power meter that I used last year because it measures total power.  Any single-sided power meter assumes that the total power is double the power that is measured on the left hand side, so has some inherent uncertainties coming from that assumption.

Secondly, I now have a second pair of wheels for my MTB.  This enables me to mount a 2nd tyre on the other rear wheel and perform a back-to-back test with less effort to swap the tyres over, and less delay between tests.


Testing protocol

I performed the testing in exactly the same manner as I did previously.  The process is briefly summarised below:

1)  Mount tyre/wheel on bike.  Measure how much weight is on the back wheel when I'm sitting on the bike (which in this case, was 54.9 kg).

2)  Warm up the tyre for five minutes at 80-85 rpm and ~150W / 24mph.

3)  Adjust tyre pressure (takes ~1-2 mins) to the desired value.  During this time, the Power2Max power meter will automatically calibrate its zero offset value.

4)  Pedal for 4 minutes in same gear, at a similar 80-85 rpm.  For the final 2 minutes, measure the average power and speed.

5) Results were recorded in the spreadsheet and the CRR was calculated using the standard Tom Anhalt method

For this test, I performed an ABABA style test (A=Thunder Burt, B=Race King), so with two repeats for the Thunder Burts and 1 repeat for the Race Kings.  The reason for repeating the Thunder Burt a second time was because I got a strange results for the first test at 16 psi.


Results and observations

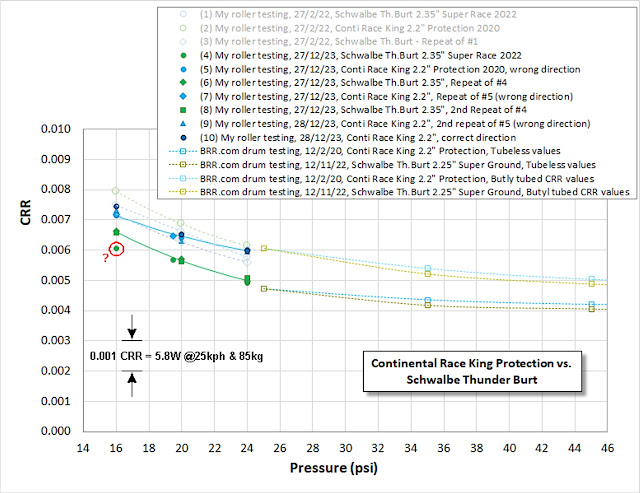
As shown in the CRR plot below, the Thunder Burt is clearly the faster tyre of the two. During test, the power needed to keep the rear wheel spinning at ~23mph was noticeably higher by 15-20 Watts for the Race King.  The results from my 2022 test are shown in grey in the plot, for reference.  Note that those 2022 tests were performed with a butyl inner tube, instead of tubeless.  This difference, together with the single-sided power meter, might account for the difference in results.

Note also that the Bicycle Rolling Resistance test results in the plot below have been updated to show the tubeless BRR results instead.  In previous years, all of the BRR testing was performed with a butyl inner tube. It's only recently in 2023 that BRR changed it's protocol and updated their results to show data for a tubeless setup whenever appropriate.

What's also noticeable in the plot above is that the results are incredibly consistent and repeatable, which I am really pleased with.  This is probably due to my new power meter which avoids errors coming from inconsistent left/right leg balance.  

There is one outlier though, one of the low pressure results for the Thunder Burt (denoted by the red circle in the plot above).  As this is a clear anomaly in the otherwise consistent data, I ignored it when of creating the green Thunder Burt trendline.

What I'm not so pleased about though (and this is a massive "DOH!"), is that I have just realised that I mounted the Race King in the wrong direction.  This is really annoying and it might be the reason why the Race King has higher CRR values than the Thunder Burt and why the differences seem to be larger than I measured previously.

I need to think what to do next.  At the moment, I am not inclined to repeat the whole test!

Addendum 28/12/23 - Correcting my mistakes

I really couldn't leave this test as it was, with Race King results for the tyre mounted in the wrong orientation.  On the following day (28th Dec '23), I decided to repeat the Race King test with the tyre mounted the correct way round.

Before re-mounting the tyre, I first performed a repeat test with the tyre exactly as it was the previous day (i.e. the wrong way round), to ensure I could get get consistent results with the previous day.  The results from this repeat test are shown with the light blue triangles in the plot below.  It's pleasing to see that the repeatability of the test results with the previous day's testing is very good, so on this basis, I didn't feel that it was necessary to repeat any of the Thunder Burt tests too.

I then removed the tyre, flipped it around and remounted it so that it was now rotating in the correct direction.  The new results for the Race King tyre mounted in the correct direction are shown with dark blue circular symbols in the plot below:

Race King versus Thunder Burt

It's interesting to see that when the Race King was mounted in the correct direction, the rolling resistance seems to be similar.  In fact, if anything the CRR values are slightly higher than when it was mounted backwards, which was a little surprising. The differences are very small though, and are the same order of magnitude as the repeatability.


Conclusion

After this additional testing, I think it's safe the conclude that the 2.35" Schwalbe Thunder Burt Super Race is a faster tyre than the 2.2" Continental Race King Protection.  The differences seem to be ~4-6 Watts of rolling resistance for a 85kg rider+bike cycling at 25kph (~15.5mph), depending on the tyre pressure.

It's worth noting that the 2.2" Race King measured slightly narrower by 0.11 inches (=2.8mm or 4.7%), which would penalise the rolling resistance for Race King relative to the wider 2.35" Thunder Burt at a given pressure.  The effect of the width difference should be quite small though I think, based of tyre width effects I've seen on BRR.com, like this test for example.

As with all roller or drum testing, it is worth remembering that testing of this nature only detects the tyre hysteresis effects of the tyres.  These tests cannot capture the other losses associated with riding off-road, such as the so-called suspension losses that that are created from the rider 'jiggling around', or the hysteresis losses that occur in the ground itself.  So for example, the CRR relationship versus tyre pressure seen in roller testing or drum testing goes in the opposite direction to what the tyre pressure effects I have seen when doing proper off-road tyre testing (see here, for example).

Nevertheless, I believe that the relative tyre hysteresis losses that are captured by roller testing of this nature are still relevant to off-road riding, and will be one element of the total rolling resistance that remains present when riding off-road.  Therefore I think this result and results from tests like it (on BRR.com for example) will still show which tyre is relatively faster.


Thursday, 21 December 2023

The Drop Bar MTB - Is it faster for Cyclocross?

In my previous blog post, I described the drop bar conversion that I did for my hardtail MTB.  I did that conversion in an attempt to create a bike that's as fast as possible for 'light' off-road duties - faster than a hardtail MTB and faster than a traditional gravel or cyclocross bike.

Based on the testing that I've done in recent years, this drop bar MTB bike should be faster on a grass surface like a cyclocross (CX) course than my CX bikesomewhat counter-intuitively.

During the latest 2023 CX season I therefore decided to use my drop bar MTB for any CX races that were dry enough to be suitable for the semi-slick Schwalbe Thunder Burt tyres.  For the muddy races, I used my CX bike with mud tyres, knowing that the grip from the Thunder Burt tyres would be terrible in mud.  It's worth mentioning that my local Cyclocross League doesn't apply the UCI rule of 33mm maximum tyre width, and doesn't have other bike restrictions, so anything is allowed.  MTBs are often used by people that don't have CX bikes.  Given the lack of restrictions around bikes, my general approach is to use the fastest bike possible, rather than sticking with tradition.

The question is, was the drop bar MTB actually faster or not?


How I judged the bike performance

I did seven CX races this season, from September through to early December.  The last one I did was a regional race, with riders entering from two Leagues (Western League & Wessex League), so that 7th race was much more competitive than the other six races, so my result was worse than the others.

For the first six Western League races, I felt that my fitness was broadly similar, and therefore my results in those six races, and my speed relative to my competitors, would provide a good indication whether or not the drop bar MTB was faster than the CX bike.

It has been a very wet autumn here in the South West of England, so unfortunately there weren't many dry races this year. 
 Of the six races, only two races were dry enough to use the drop bar MTB.  Even for those two, the courses were still muddy in places.  So for two of the races, I used the drop bar MTB, and for the other four races I used my CX bike with 33mm Challenge Handmade Tubeless Ready Clincher mud tyres, with the tyre model choice based on the level of muddiness (either Baby Limus or Limus).

I analysed my performance relative to my competitors in two ways:

1) What my finishing position was relative to the size of the field, calculated as a percentile.  For example, if I finished 20th out of a field of 50 people starting the race, that's a 40th percentile finishing position.

2) Secondly, what my finishing time was relative to the winner.  For example, if the winner finished in 1 hour and I finished in 1 hr 6 minutes, my 6 additional minutes make me 10% slower than the winner's time of speed.

Of these two methods, I think the first one is a slightly more reliable method, because the second method is influenced by a single person; the winner's performance. It therefore depends on whether the fastest rider in the region raced in a particular weekend and how he performed in that race.

It's worth noting that although I changed bike and tyre width for each race depending on the conditions, almost everybody else in the field, especially the top riders, used the same cyclocross bike with 33mm tyres for all their races. 


Results

The plot below shows the results using these two methods.  Regardless of the method, it's clear that I achieved better race results using the drop bar MTB than my CX bike.  Like many things, this is not 100% conclusive, but I still think it's a strong indication that the drop bar bike is faster.

Drop bar MTB versus Cyclocross bike


Saturday, 28 October 2023

New cyclocross tyre rolling resistance testing using virtual elevation analysis

Cyclocross Challenge Grifo Baby Limus rolling resistance tyre testing with inserts
A few weeks ago I did some additional tyre rolling resistance testing using proper 33mm wide cyclocross tyres, with foam tyre inserts installed in them.

The aim of my testing was to check how tyre pressure affects rolling resistance and in particular to see whether the installation of tyre inserts would negatively affect rolling resistance at low pressures, when there is greater deformation of the tyre (and potentially deformation of the insert).  The results confirmed my previous testing, that lower pressures are faster, and also showed that the presence of tyre inserts doesn't affect that conclusion, that lower pressure is faster.


Previous testing

2020 CX tyre testing: I first performed off-road rolling resistance testing in 2020, during the first Covid-19 wave, and described previously in this post.  That testing used Schwalbe X-One tyres (the blue curve in the plot above).  The surprising results of that first test was that on grass, even with dry & hard underlying ground, lower pressures were always faster, producing lower CRR values.

2022 MTB tyre testing: In 2022 I repeated the test method but using my hardtail mountain bike.  The results are described in this post here (and shown above with the red curve).  That testing used Schwalbe Thunder Burt tyres and also showed that lower pressures were always faster, albeit with a more subtle effect of tyre pressure on CRR values.


New testing

In previous cyclocross seasons I have done only a handful of the races, often picking the early season races that had the best and driest weather.  For this coming cyclocross season, I intend to do most of the races throughout the season, including the muddy ones, therefore I have bought some good quality 33mm cyclocross tyres that will be suitable for the later races in the season.

The tyres I bought are Challenge Handmade Tubeless Ready (HTLR) tyres, which are 33mm wide.  I have a Baby Limus on the front, and a Grifo for the rear wheel.

In addition, I installed these tubeless tyres with tyre inserts because from what I have read (for example, here), the use of inserts allows the tyres to run at lower pressures.  I ordered some Tubolight tyre inserts, as described in the article, but I was disappointed to find that they are simply closed cell foam cylindrical rods with a diameter of about 25mm.  

Considering the price of ~£50 for the Tubolights, I decided to instead return them and instead go the DIY route. I bought some 25mm 'backer rod' from Ebay, for ~£10 for 10 metres, and made my own inserts.

Having installed the inserts, I was keen to measure the rolling resistance at different pressures.  I'll be aiming for pressures around 20-24 psi probably in the races, and with such low pressures there is a chance that the compressed contact patch will touch the insert and cause a higher rolling resistance.

I was pleased withe results (below), which showed the similar trends to my 2020 CX tyre testing, albeit with high CRR values due to the softer ground.  In conclusion, lower tyre pressures are still faster, and the tyre inserts don't seem to negatively affect the rolling resistance.  A reduction of 5 psi, from 25 psi to 20 psi saves around 6 Watts of rolling resistance at 15 mph.


Wednesday, 29 June 2022

Testing MTB tyre rolling resistance using virtual elevation analysis

Mountain bike tire rolling resistance testing for optimum pressure
In a previous post from 26th April 2020, I described the rolling resistance testing that I did using my cyclocross bike, to determine the best pressure to run my tyres at, for CX races on grass.

The surprising result from that test was that there was no optimum pressure for my 35mm wide cyclocross tyres. The test instead showed that lower pressures are faster, even down to pressures that are impractically low.

Since then I've been really interested to see if the same trend holds true for other types of off-road riding, such as mountain biking.  Rolling resistance expert Tom Anhalt made an interesting comment on a Slowtwitch forum, in response to my 2020 results, saying that he remembered seeing results from the Swiss MTB Team who performed similar studies and they also concluded that lower pressure is faster.  I was keen to test this for myself, and finally had a chance to do it in June 2022.

Method

The test and analysis method I used was the same as the one that I used previously for the cyclocross tyres, described here.  There were a couple of minor differences this time:
  • I performed a repeat at only one pressure on the grass surface, whereas for the previous cyclocross tyre test, I did several off-road repeats.
  • On the other hand, I did two road tests, before and after the off-road testing, to get a feel for the repeatability of my CdA estimate.
It's also worth noting that my MTB has a spider-mounted power meter, a Power2max power meter, which measures power from both legs, whereas my Cyclocross bike had a left-hand crank-based Stages power meter.  In theory, the Power2Max power numbers should be more reliable, as it records total power properly.  In addition though, I know there are some small differences between the power measurements from my Power2Max and Stages PMs from the comparative testing that I've done previously (see here and here).  All of this means that the rolling resistance numbers aren't strictly comparable between the two bikes, the MTB and the CX bike. However, rolling resistance differences for different pressures, for the the same bike, should be reliable.

Another thing to note is that I used the same grass field for the testing as I used previously.  A grass field obviously isn't particularly representative of a typical MTB trail, but I used it mainly because:
  • There's no need to brake.  Any braking would screw up the VE analysis.
  • It's quiet and free from other riders or people getting in the way.
  • I was able to ride a consistent line around the field each time.
  • Finally, I sometimes use my MTB for cyclocross races, so I was anyway interested in the optimum MTB tyre pressures on grass.
I've thought carefully about how I could use a more representative MTB trail loop. However, I've been unable to find a suitable local trail, that allows a consistent line to be ridden, and that requires no braking etc.  This, I feel, is a fundamental problem for performance testing of mountain bikes.  Facilities like the new Vittoria testing facility offer a possibility to overcome such difficulties, and I'm looking forward to what kind of testing might be done at this facility.
 

Results

Optimum Pressure

The results shown in the plot below, which is the same plot as the one at the top of this blog post, show that the MTB tyres have a lower sensitivity of tyre pressure to rolling resistance than the CX tyres.  I would describe the MTB tyre red curve below as showing a flatter optimum, where the CRR doesn't change much between pressures of about 13 psi and 24psi.  The difference in rolling resistance across that pressure range is equivalent to less than a couple of Watts at 15 mph.  This is a convenient result, because I tend to run pressures between about 16 and 20 psi in these tyres, for comfort and grip reasons, in addition to rolling resistance considerations.  Therefore, I'll continue to run those kinds of pressures, as they seem to be best for rolling resistance too.


Other observations

Comparing the red and blue curves in the plot, for the MTB tyres and CX tyres respectively, shows that the MTB tyres are clearly faster tyres on grass, which is a conclusion I'm confident in, despite the power meter differences etc, because the difference we see there are so large.  The MTB tyre CRR values are about one third less (~40W) than for the CX tyres, which is more than the uncertainty coming from PM differences and differences in testing conditions on the day.  

The results also show that the rolling resistance of the tyres on the road doesn't change much between the two results at 34 psi and 16psi, which is a little surprising.  If I compare these data points against results of independent drum testing and my previous roller testing,  shown in the plot below, I see reasonable agreement with roller testing at the the lower pressure of 16 psi, but the 34 psi rolling resistance coefficient is much higher than the values from Bicycle Rolling Resistance obtained from their drum testing.  I can only think that this difference might be coming from higher suspension losses at 34 psi when riding the MTB over the fairly rough tarmac surface of my Aztec West road test loop.  I remember that AeroCoach's CEO Xavier Disley once said that he rarely sees long stretches of UK road surface that have a CRR less than 0.006 - and his comment was for the CRR of road tyres, not MTB tyres.  The CRR values from drum testing, which are less than 0.006 at 34 psi would not be achievable in real life based on this information from Xavier Disley, and this is my best explanation for the mismatch at 34 psi.


Wednesday, 16 March 2022

Testing Schwalbe's Super Race Thunder Burts

Schwalbe Thunder Burt Super Race versus Continental Race King Protection rolling resistance
A few months ago, Bicycle Rolling Resistance (BRR) tested the latest version of Schwalbe's Thunder Burt with the 2.25" Super Ground casing (see results here).  It performed really well, narrowly beating the previous best mountain bike tyre, the 2.2" Continental Race King Protection (see results here).

As BRR said in it's conclusion: "The current generation has moved to Schwalbe's Super casings with a Super Ground and Super Race version available in several sizes. As the name suggests, the Super Race should be a bit faster than the Super Ground, while the Super Ground offers a bit more protection"

"...It looks like the Super Race version of the Thunder Burt is racking up quite a few votes and has a good chance of being tested in the near future as well."

Sadly though, the Super Race version of the Thunder Burt never made it to the top of the voting list and it expired from the list last month.  I was a little disappointed by this, but I decided to buy a pair of those tyres anyway, particularly as I have an upcoming beach race in April that the Thunder Burt tread is perfect for.  However, I wanted to test them first, to check how they performed against the Continental Race King Protection that I already own and have installed on the back of my MTB.


Equipment and test setup

I used my roller method for this testing, which I've described recently in previous blog posts.

The testing wasn't particularly straight-forward though, because my mountain bike doesn't have a power meter.  I only have power meters on my road bike, my cyclocross/gravel bike and my time trial bike.  Those are all Shimano Stages left hand crank-based power meters.  My mountain bike has a SRAM GXP mountain bike chainset, so the chainset isn't at all compatible with those power meters.


Shimano 105 Stages power meter on a Shimano SLX mountain bike (MTB) crankset
My solution was to use my commuting bike instead, which has a Shimano crankset and bottom bracket, albeit a MTB chainset instead of a road chainset.  Road and MTB chainsets are not compatible though, having different axle lengths and Q-factors.

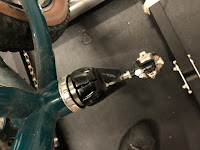
This meant the chainset axle was too long for the Stages 105 left-hand crank arm that I tried to fit on it.  It did fit on the hollowtech tech splined axle, both having the same diameter and splines, but it left a gap between the crank arm and the bottom bracket cups.  I needed a 5-6mm spacer or washer to fill the gap.  I found that a spare set of axle cartridge bearings filled the gap perfectly (see photo above).  This was a bodge, but it worked really well.  As a result, I got my Shimano 105 power meter successfully working on the left hand side of my Shimano SLX chainset.

A bit more faffing was required to do the testing though: I had to remove my SKS mudguards, which rubbed on the large knobbly mountain bike tyres, and I changed the pedals to my good clipless SPDs too.  All in all, it took a fair amount of time before I could get started.

I chose to do the testing with a lightweight (150g) butyl inner tube, just to save the time and mess associated with a tubeless set up.  Since I was interested in which tyre was fastest, this approach was fine, because both tyres would be subject to the same additional losses from having the inner tube installed.  Furthermore, doing the testing with an inner tube allowed a better comparison with the BRR data, which also used a butyl inner tube for their testing, albeit a heavier-weight inner tube.


Results

The plot below show how the the two tyres compare.  I had enough time to repeat the testing for the Thunder Burts, after testing the Continental Race King, to confirm that Thunder Burts really does give lower CRR numbers.  Since the two blocks of testing with the Thunder Burts were before and after the testing with the Race King, then I can be fairly confident the Thunder Burts are a better tyre, despite the imperfect repeatability seen in the plot below. 


The differences aren't massive, and correspond to only 2-3 Watts at 25 kph, but it's a benefit worth having.  Something to be noted is that the Thunder Burts were slightly larger than the Race King, at 2.35" width versus 2.2".  In addition, the Thunder Burt was brand new, whereas the Race King was one or two years old and has some Stans sealant residue on the inside.  This latter point might be a source of additional losses, I'm not sure, but in any case, the purpose of this exercise was to compare these two tyres ahead of my upcoming race, so these old and used tyres are the ones I would have chosen from anyway.

Finally, it's worth noting that the agreement with Bicycle Rolling Resistance data is remarkably good at the interface of the two sets of data.  However, this might be a fluke.


Monday, 14 March 2022

Do foam tyre inserts get smaller when tyres are inflated?

Compression of MTB / gravel / cyclocross foam tyre inserts when inflated
The previous foam tyre insert testing I did (see previous blog post here) gave some interesting and surprising results.  
I was expecting the foam tyre inserts to cause a small rolling resistance penalty, especially at very low tyre pressures of around 15 psi. However, they didn't.  The effect of the foam tyre inserts on CRR (coefficient of rolling resistance) was within the precision of what could be measured in the test, so the effect was very small or nothing.  The results are re-shown in the plot below (the green symbols versus the blue symbols). 

This surprising result got me thinking about the causes.  Why don't the foam tyre inserts have an effect on rolling resistance?  At low tyre pressures, the compression of the foam insert at the contact patch should generate hysteretic losses that manifest themselves as additional rolling resistance. Why is that not seen?  It got me thinking.

One possible explanation, and one that I mentioned at the end of my previous post, was that the ends of the inserts were (unintentionally) not connected when I did the testing, so the foam insert was 'free floating' in the tyre cavity, rather than held tight against the rim.  This is a plausible explanation for an absence of any effect at higher pressures.  However, I would still expect the foam insert to get compressed at 15 psi, when the tyre drop (the squish) should have been enough to compress the foam insert.

There is a second possible explanation for this observation, though, for the lack of a measurable effect of the tyre inserts.  I remembered that when Vittoria launched their Air Liner Road tyre insert for road bikes, they explained that their inserts compress into the rim bead when the tyre is inflated, because the foam is closed-cell foam.  The effect of the tyre pressure on the Vittoria Air Liner was demonstrated nicely in their video below:


This is the reason why the effect of the Vittoria Air Liner on tyre rolling resistance measurements was negligible when it was tested by Bicycle Rolling Resistance here.  It might be the same reason why Aerocoach reached the same conclusion, but for the Tubolight Road insert in their rolling resistance testing here.

Could the same thing be happening for my gravel/cyclocross tyre inserts, that they are shrinking when the tyres are inflated?  I didn't even know whether the foam inserts were constructed from closed-cell foam or not.

I decided to do an experiment to find out.  The method and results are shown in the YouTube video below:


Results


So, the answer is a YES, they do shrink, and quite a lot!

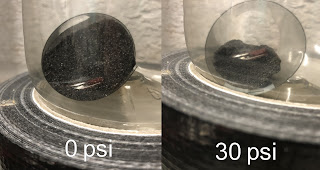
It confirms that my budget Planet X foam inserts are indeed made from closed-cell foam, and so they were subject to the same compression mechanism as the Vittoria Air Liner Road tyre insert.  The picture to the left shows the cross section of the tyre insert as the pressure is raised from zero to 34 psi.  At 34 psi, the insert has shrunk to about a third of it's original size.  At 15 psi, it would have been approximately half it's original size.

So finally, this is plausible explanation, and the most likely reason why I saw no effect on rolling resistance when I tested at 15 psi:  The tyre insert had already shrunk enough that it wasn't actually getting compressed at the tyre contact patch on the rollers. 


Do tyre insert companies know this happens?

We know that Vittoria have figured this out, but what about other tyre insert companies?  I'm not convinced they have.

If I look at some of the promotional pictures on the websites of the various companies selling foam tyre inserts, I get the impression they don't realise this compression is happening.  For example, I have shown on the left a few pictures taken from some of the company's websites. These all show the foam tyre inserts inside the tyres rolling over objects, but the inserts are the same size and shape as their pre-inflated size.

Either the tyre insert companies don't realise what's going on, or they are trying to mislead people.

It could be argued however, that this doesn't matter, and that it's the performance of the tyre inserts that matters.  I would agree with that, and the testing done by PinkBike shows that these tyre inserts do still work (for rim protection), regardless of them probably shrinking when the tyre is inflated.  
However, I think it's still important to understand what size and shape the insert becomes when it's inside the inflated tyre.  For example, is it still going to be wide enough to cushion and protect the rim flanks, or will the insert become too small for that, and instead get pushed down into the rim well and central channel?  That will affect how impact loads are taken by the rim structure.

What many of these companies show is happening, and possibly what they think is happening, inside the tyre is probably not what's actually happening.  It will depend on the construction of the tyre insert though, and how much air is contained in the tyre insert material.  Nevertheless, what's important is to check what size and shape the insert becomes when it's inside an inflated tyre.  Apart from Vittoria, I haven't seen other companies address this.


The physics behind what's happening

This final section may not be interesting to many people, but as an addendum, I can explain why a closed cell foam tyre insert shrinks when the tyre is compressed.

My foam tyre insert has a volume of around 1280 cubic centimetres and weighs 34g.  That means its density is 26.6 kg per metre cubed, which shows that most of that volume is air; air inside the closed cells of the foam.  In view of the density value, I would guess that more than 95% of it is air.

Before installing the tyre insert, the pressure outside and inside the foam insert is at atmospheric pressure, which is 14.7 psi at sea level.  When the pressure outside of the foam insert increases, however, as happens when the tyre is inflated, that external pressure causes the air cells inside the foam to compress to the same pressure.  This is the same principle as when you sit your 80kg backside on a chair: The chair and floor has to push upwards with a force of 80kg.

The volume of the air cells reduces under this increase pressure, as dictated by Boyle's law. Boyle's law says that the volume of a gas (air in this case) is inversely proportional to pressure, for a fixed mass and temperature of gas.  This means that if the pressure doubles, then the volume must half.

For our particular application, a doubling of the pressure means putting 15 psi into the tyres, because remember, the pressure started at one atmosphere, which is about 15 psi.

And what happens if 15 psi is applied?  The volume of the foam tyre insert approximately halves, as shown on the left.  This is a good demonstration of Boyle's law.  Another demonstration of Boyle's law, very similar to this, can be found here, which is the link on the Wikipedia page.

People very familiar with these gas laws may already realise that for the case rapid inflation or deflation, as shown in my video, the expansion is not strictly following Boyle's Law.  This is because Boyle's law assumes an isothermal (constant temperature) expansion or compression.  A rapid expansion or compression is an adiabatic process (no heat transfer) instead of an isothermal one, and is therefore subject the Ideal Gas Law instead, which considers temperature changes on pressure and volume (whereas Boyle's Law assumes temperature is fixed).  In the case of a tyre being quickly inflated, if the pressure is doubled, the volume won't be halved but will be 61% instead. This 0.61 value come from 0.5 raised to the power of (1/gamma), where gamma is the specific heat ratio for air, which is 1.4.

What's important though is what volume the foam tyre insert will be when it's in the inflated tyre being ridden.  In that case, the foam insert and the tyre will have reached thermal equilibrium after half an hour or so, so in all practical riding cases, where tyres would have been inflated in advance of the ride, thermal equilibrium would have been reached, and so Boyle's law is appropriate.