
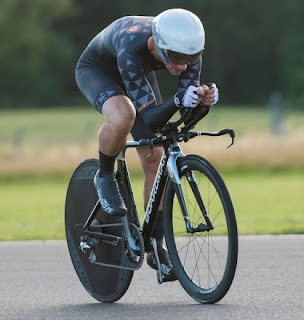
I have been doing time trials since about 2017, having converted my old winter road bike to a time trial bike, using a set of clip-on aero bars.
Over the last 4 years, I've made various improvements to the bike, my kit, and more importantly my position on the bike.
My time trial times have gradually improved. Not significantly so, but considering my power hasn't really improved during that time, these speed improvements are a result of improvements to my equipment and position.
I do a combination of local club 10 mile evening time trials and also 10 mile TTs organised by DBmax at the local Castle Combe motor racing circuit. I used the data collected from these Castle Combe time trials to analyse my improvements in performance, particularly my aerodynamic efficiency (CdA), which is a parameter that's critical for good time trial performance.
2017 Equipment

Over the last few years, I made a number of improvements. Often, when I had to make a choice about equipment or kit selection, to decide which was fastest, I did aero testing using the Chung Virtual Elevation Method to determine the CdA of various set-ups. I haven't been exhaustive in my Chung testing, because it’s quite time consuming to do properly, for every change. However, I've used it for a few things, for example to compare two different helmets and two different skinsuits.
The plot at the top of this post shows the improvements in my apparent CdA over time, determined using the free Golden Cheetah Aerolab software. This type of CdA calculation assumes no wind, hence I call it 'apparent CdA'. Furthermore, for all data points, I have assumed similar values for weight and rolling resistance. Consequently, any improvements in either of those two things will appear as benefits in the apparent CdA value. My weight and the rolling resistance of my tyres has been reasonably consistent though, so this is an acceptable simplification I think.
The largest improvements in CdA seem to have come from lowering my aerobars, allowing me to get my back flatter and my head lower. I haven't specifically tested bar height via Chung testing, but the biggest improvements in CdA seem to correlate with bar height. Interestingly, the bar height adjustment was the cheapest upgrade of all, costing me just £15 for an adjustable stem from Decathlon. All other kit upgrades, costing probably £1000-£1500, didn't seem to be as effective at reducing my CdA. So the best modification was also the cheapest one.
Subjectively, my position now looks much better on the bike. In addition to my position changes, I've also improved the bike and kit:
2020/2021 Equipment
Speed Improvements
The plot below shows the improvements in my CdA over time, as a result of the bike and positions improvements I've made. The colour of the points indicates the average speed for each 10 mile TT. The size of the circular points indicates that average power I managed to achieve.
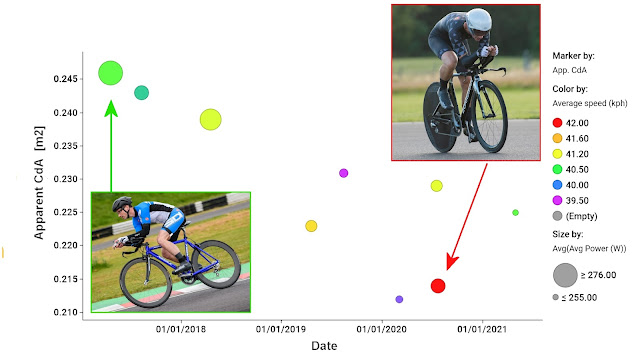
As can be sWhat's clear from the plot above is that the fastest times were not achieved with the highest power (largest circles), but actually the speed is a function of both power and CdA. In fact, it's clear from the speeds that a reduction in power, often a result of being lower at the front, is more than compensated by an improvement in CdA, resulting in net benefit for the average speed.
For time trials, it's often said that you want to maximise Power divided by CdA. All things being equal, a time trial average speed will be dependent on this parameter, Power/CdA. For example, if CdA can be reduced by 10%, then the power required to maintain the same speed also drops by 10%, simple as that.
I wanted to see how my time trial average speeds correlated with Power/CdA. However, since I was comparing time trial performances on different days, I also wanted to account for changes in air density from day to day, since air density directly affects aerodynamic drag and therefore speed. Lowering the air density by 10% has the same effect as reducing the CdA by 10%. The air density effect can be incorporated by considering Power/[CdA*Rho] as the parameter to plot speed against, instead of Power/[CdA].
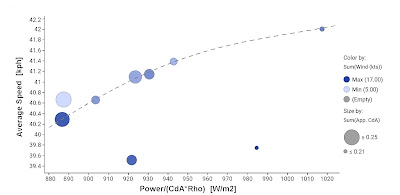
The plot below shows how my average time trial speeds correlate against Power/[CdA*Rho].
In the plot above that you can see that my average speed generally correlates well with Power/[CdA*Rho]. There are, however, two annoying outliers where my speed was very low considering my average power, the air density and my apparent CdA. I don't yet understand what has caused these two outliers. I've checked my Golden Cheetah virtual elevation calculation (the CdA calculation) and those seem fine. It might be something as simple as a badly calibrated speed sensor or a power meter that hasn't been zero'd.


