
If there is a penalty at all, then it's very small, at least for the tyre inserts that I tested. Read on for more details...
Why I've been using tyre inserts
 About two years ago I tested the effect of tyre pressure on rolling resistance, using my Cyclocross/Gravel bike ridden on a grass field. That test used the Virtual Elevation (VE) outdoor method. The tyres I used were 35mm Schwalbe X-One Allround tyres. The results were explained in my previous blog post here.
 I previously used 35mm Schwalbe X-One tyres for my outdoor rolling resistance testing. However, in 2020 I swapped to 43mm Panaracer Gravel King SK TLC tyres after I damaged one of those Schwalbe tyres in the double-flat incident. Panaracer Gravel King SKs get good reviews and are a more summer-focussed tyre, which suits my riding. Also, they test quite well in terms of rolling resistance, based on measurements made by BicyclingRollingResistance.com.


 The rear wheel weighing was done using my front fork mount, by lifting the bike off to the side of the rollers and onto the bathroom scales. As before, timber blocks were use to ensure the bike was horizontal while on the scales, thus ensuring the scales weighed the same rear wheel weight as the weight that's on the rear wheel for the rollers.


Those results from 2020, shown in the plot on the left, really surprised me because there was no 'optimum' tyre pressure. The red points continue the downward CRR (rolling resistance coefficient) trend towards the left hand side of the plot, for lower pressures. I was expecting there to be an optimum pressure somewhere, that gave the minimum rolling resistance. However, the testing showed that lower tyre pressures were always best, even at pressures so low that the tyre became laterally unstable. Rolling resistance expert Tom Anhalt commented on a forum that other people had found similar similar results to this in the past, for MTB tyres, finding also that lower pressure was best for rolling resistance.
After this testing, I began to run lower pressures on my cyclocross bike, to exploit these rolling resistance advantages, and in doing so also gained some comfort and grip benefits. The potential problem with running lower tyre pressures though, as all mountain bike and cyclocross riders will know only too well, is an increased risk of rim damage and pinch flats if you hit a sharp object.
Indeed, several weeks later, while I was out on a ride I double-flatted my tubeless Schwalbe X-One tyres after hitting a concealed rock. One tyre was punctured so badly that it struggled to hold air, even with tubeless 'bacon' repair strips inserted into the tyre hole. I just about made it back home. One of the tyres was badly damaged and had to be thrown away.
My motivation for using foam tyre inserts, then, was to allow me to run lower pressures, to take advantage of the rolling resistance benefits shown in the plot above, but reducing the risk of rim damage and pinch flats.
I have been using foam tyre inserts for almost two years now on my cyclocross/gravel bike. Although I've been generally very happy with them, I've always wondered in the back of my mind whether I'm paying a rolling resistance penalty by using the foam inserts. If it's a large penalty, it might actually cancel out the benefit of running lower pressures. That's why I wanted to do this testing.
Available Data
As far as I'm aware, there has been very little testing of rolling resistance done and published for the commercially available tyre inserts, which is a shame, and this is the reason I've done this testing.
Testing of tyre inserts, especially for mountain bike applications, usually involves only a qualitative assessment of the effect of tyre inserts on the ride feel, tyre stability, tyre damping and rim protection. Some quantitative testing was done by Pink Bike last year, but that testing was limited to evaluating rim impact protection only.
Testing of road tyre inserts has been done by Aerocoach and Bicycle Rolling Resistance, both concluding minimal impact on rolling resistance, but tyre liners for road tyres is not something that interests me, because for road use there isn't the same benefit or desire to run very low pressures.
To be honest, I find it a little frustrating that tyre insert companies don't provide rolling resistance data. Often they don't even address the rolling resistance question at all. This is perhaps understandable if downhill mountain biking is the target market, but for gravel and cyclocross applications, like this this one or this one, then I'd like to see rolling resistance data provided by the tyre insert companies.
I'm also really hoping that Bicycle Rolling Resistance will do some tyre insert testing for MTB and gravel inserts soon. It's on their voting list, but far from the top of the list at the moment. Tyre inserts aren't cheap, so I can't justify buying a variety of brands and testing them myself.
My tyre and foam tyre insert set-up
The foam tyre inserts I bought were from Planet X, called "Barbieri Anaconda Puncture Protection System". These are  no longer available to buy from Planet X, but they are budget round-section 'pool noodle' type closed cell foam inserts. They cost £19.99 including valves.
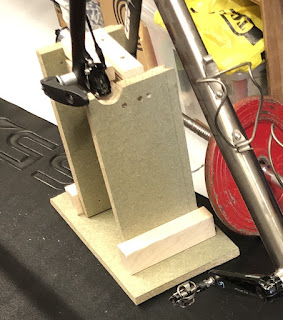
At the time of installing them, I was conscious that the rolling resistance might suffer, so I trimmed the top of the round section off, as shown in the photo to the left. The aim was to provide more of a gap between the outside of the foam insert and the inside of the tyre, trying to prevent the tyre from touching the foam insert at the contact patch. Through some tyre drop measurements, I worked out that the inside of the tyre would touch the insert only at pressures below 14-16 psi on a flat surface, which corresponds to a tyre drop of around 15mm. However, it should be noted that the same 14-16 psi tyre pressure should result in a larger tyre drop when it's on the rollers though, because their small roller diameter exerts a higher localised load on the tyre at the contact patch.
The photo below shows some quick (rather crude) measurements of the tyre external depth and also the depth of the foam tyre insert.
The width of the tyre and the foam insert are shown below. The foam insert is fairly narrow, at 30.4mm, considering the rim has an internal width of 23mm and an external width of 28mm. Nevertheless, when riding over rocks and other obstacles, I felt qualitatively that the foam inserts were being compressed whenever I hit obstacle that would have otherwise caused the tyre to bottom-out. It didn't feel like the usual tyre-on-rim contact that you get without tyre inserts installed.
Test method selection
My test method was the same roller testing, as I described in my previous blog post. Why roller testing though? Virtual elevation (VE) testing would have been suitable too, based on my previous experiences, but VE testing is significantly less convenient:
- VE testing takes much longer to perform, several hours as opposed to about one hour for roller testing.
- VE testing needs good conditions: Low wind days are needed, and obviously also daylight, which is more difficult in winter.
- For VE testing outdoors, the ground needs to be fairly robust, so that multiple runs don't degrade the ground and lead to a drift in the rolling resistance being measured. This generally means that for off-road applications, the ground needs to be dry. Again, that's difficult or impossible in winter (in the UK).
In its favour, VE testing does however provide the complete picture of all three rolling resistance losses: (1) Tyre hysteretic losses; (2) suspension/impedance losses; (3) ground deformation hysteretic losses. Roller testing on the other hand will only provide an indication of #1, the tyre hysteretic losses. However, for foam tyre inserts, I felt that this was the primary mechanism by which inserts might cause additional losses. Therefore, I decide that roller testing was the best method for this situation.
Test method description
I started with the foam insert installed in the tyre, performed the tests with various pressures, removed the foam insert, then repeated the tests with various pressures again without the insert in place.
For the roller testing, I performed a few repeats throughout the test, three specifically, which helped give me a feel for the repeatability of the results from this testing. The repeat runs are included in the results shown below.
Results
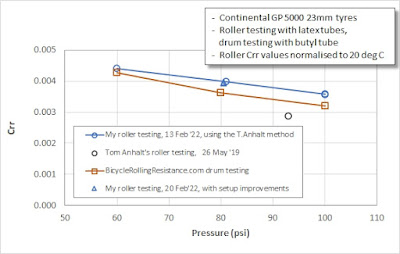
The test results are shown in the plot below, with the green and blue symbols. The dashed lines are best fit lines put through the data. Data from Bicycle Rolling Resistance and from Tom Anhalt's testing is also shown in the plots, although it should be noted that for those tests there are differences in the inner tube being used and also the tyre width.
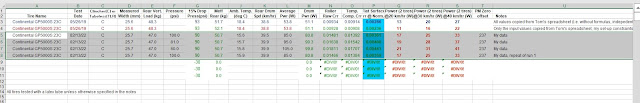
The raw data is shown in the spreadsheet screenshot further below:
The plot above shows that the effect of the foam tyre insert is small and possibly nothing at all. If there is an effect of the foam insert on rolling resistance, it's close to the precision and the repeatability of what can be tested I think, so less than about 2-3 Watts at 25 kph.
I was expecting a larger difference at low pressure, where the foam insert might have been getting compressed. However, even at 15 psi, the differences are small. The best fit lines suggest there is a larger difference at 15 psi, but the green and blue data points aren't a lot further apart at 15psi than they are than elsewhere. Additional testing to collect more points (repeats) would be needed if I wanted to really confirm that.
Conclusion and caveats
In any case, the conclusion is that the effect of these foam tyre inserts is small at the most, and possibly nothing.
There is one final caveat to mention though: When I removed the foam insert I noticed that the tape holding the two ends of the foam insert had come apart and so the two ends of the foam insert weren't attached to each other. I don't know when this happened, but it means that the foam insert was probably 'free floating' inside the tyre cavity, rather than being a continuous foam hoop held in contact with the rim and tyre bead. In a way, it would have been behaving rather like a Huck Norris foam insert, but possibly with even less contact with the tyre, owing to it's small diameter. I don't know if this has an effect, but it's important to note. I didn't have the time or inclination to repair the foam insert (to clean and re-join the ends), re-test all the pressures, and then remove the tyre again to check it was still okay. A free-floating foam insert might possibly cause lower rolling resistance losses, because it is not contacting the tyre side wall near the rim. However, at this point I can only speculate.


 testing using rollers")
 testing using rollers")


