This allows you to ride real roads inside RGT Cycling, so either local roads that you've ridden already, or famous roads that you'd like to ride (created by other people).
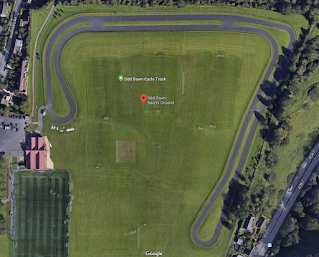
In this time of COVID-19 restrictions, it means that virtual races can be organised on real racing circuits, which is pretty cool. Somebody else has already uploaded my local Odd Down Cycle Racing Circuit to the magicroads.org website. Virtual races are being organised by PDQ Cycle Coaching, the guys that organised the real life races I did back in 2019.
I thought it would be interesting to compare my real life cycling speeds around the Odd Down Circuit with the virtual speeds achieved in RGT Cycling.
Real life speeds
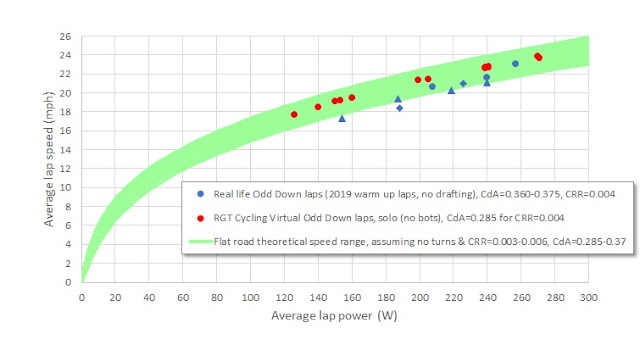
I extracted speeds from three races I did in Spring/Summer of 2019. I only extracted speed from the warm up laps, not the races themselves, so that the speed would not be subject to drafting. The average power during these warm ups varied from about 150W to 260W. I usually do a ramp-type warm up, with the power held constant for 2-3 minutes at a time before increasing it. Therefore, most of the warm-up laps were done at roughly constant power.
The data from three separate warm ups (three different days) allowed some checking of the influence of external weather conditions, which would affect average speeds. Lap speeds were obtained from Strava for the one-lap segment that has been created in Strava. Results are shown below with blue symbols.
RGT Virtual Speeds
I rode the Odd Down Circuit in RGT Cycling on Saturday 6th Feb 2021, selecting no bots, so that my riding would be solo, with no drafting. The speeds were measured in the same way, using a Strava segment, and are shown with the red symbols on the plot above. The RGT ride was also loaded into Golden Cheetah, making similar assumptions about CRR=0.004, drivetrain efficiency (97%), weight (80 kg) and air density (1.2 kg/m3). This gave a CdA value of 0.285, which is quite a lot smaller that my real life CdA of 0.360-0.375. Incidentally, I saw a tweet from Robert Chung a while ago, saying that he had found that Zwift also assumes a rather optimistic CdA of 0.28.
Differences and possible reasons
The general agreement in the plot above seems to be not too bad on the face of it, but it's not great either. The RGT speeds are approximately 1-2 mph higher, and this I think comes primarily from the lower CdA assumed by RGT. The difference of CdA, 0.285 in RGT versus 0.370 in real life, is quite significant. That difference would result in a speed difference of 1mph at 250W, or about 30W at a fixed speed.
Of course, RGT is not trying to simulate me personally, and it has no idea how aerodynamic my bike and body combination is, or was during those warm ups. It's worth bearing in mind that my warm up laps were done on the hoods with fairly straight arms, so that position will be less aerodynamic than what RGT is assuming. I also wasn't wearing a skinsuit, and hadn't shaved my legs, both of which the RGT avatar has. These are differences that Specialized have shown in their videos have a significant effect on aerodynamic efficiency.
It's also worth noting that I used the same power meter for all rides, including indoor RGT ride, so there should not be a bias coming from using different power meters. It is possible that my left crank only power meter is slightly over-estimating my power, and there is some evidence of this based on recent testing. An over-estimated power would result in RGT speeds that are higher than real life, and could also partially account for the different apparent CdA values.
Overall though, I think the differences are primarily coming from the different riding position that RGT is assuming (horizontal forearms), relative to the position I adopted during my real life warm ups (almost straight arms, more upright torso). Wind tunnel test performed by Aerocoach in 2019 showed that dropping the elbows into a horizontal forearm position ('breakaway hoods') significantly reduced Xavier Disley's CdA from 0.3506 m^2 to 0.2718 m^2. This reduction of around 0.08 m^2 is very similar to the CdA differences extracted from my RGT ride and my real life rides, for similar changes in position. Therefore, I conclude that the RGT cycling simulation is accurate, once you factor in the cycling positions that are assumed and adopted by the RGT avatar.
Besides this quantitative comparison of speeds, there is a qualitative element too, particularly around the cornering. I found the RGT simulation of corners to be fairly realistic. In real races, I usually have to brake for the hairpins due to the concertina effects when riding in the bunch. During warm ups or solo breakaways, though, I often don't need to brake. I remember holding about 280W during one solo breakaway and not needing to brake, although that was very close to the limit. In RGT, the same thing happened, with just a momentary 1-2 seconds of braking before the bottom hairpin during the laps at 270W. Qualitatively, this seemed to agree with real life, although it's difficult to be too conclusive.
Conclusion
All in all, I'd say that the RGT simulation is a realistic simulation of real life riding around my local Odd Down Cycle Circuit. Where differences exist, I think there are some plausible explanations for what might be causing those discrepancies.


0 comments:
Post a Comment